

Studio
Studio is where intelligence becomes action. The Agent researches. Canvas creates. Workflows scale. Everything is grounded in what PG:AI actually knows about your accounts.The Agent
This isn’t the Q&A assistant from V1. The new Agent works autonomously on your behalf: multi-step research, live data sources, content generation, and actions across your accounts. Ask it to prepare you for a meeting and it pulls strategic priorities, attendee profiles, competitive positioning, and recommended questions, all cited back to sources. The Agent has full access to every intelligence dimension for the account you’re viewing. Every response is grounded in what PG:AI actually knows, not a generic LLM answer.Canvas
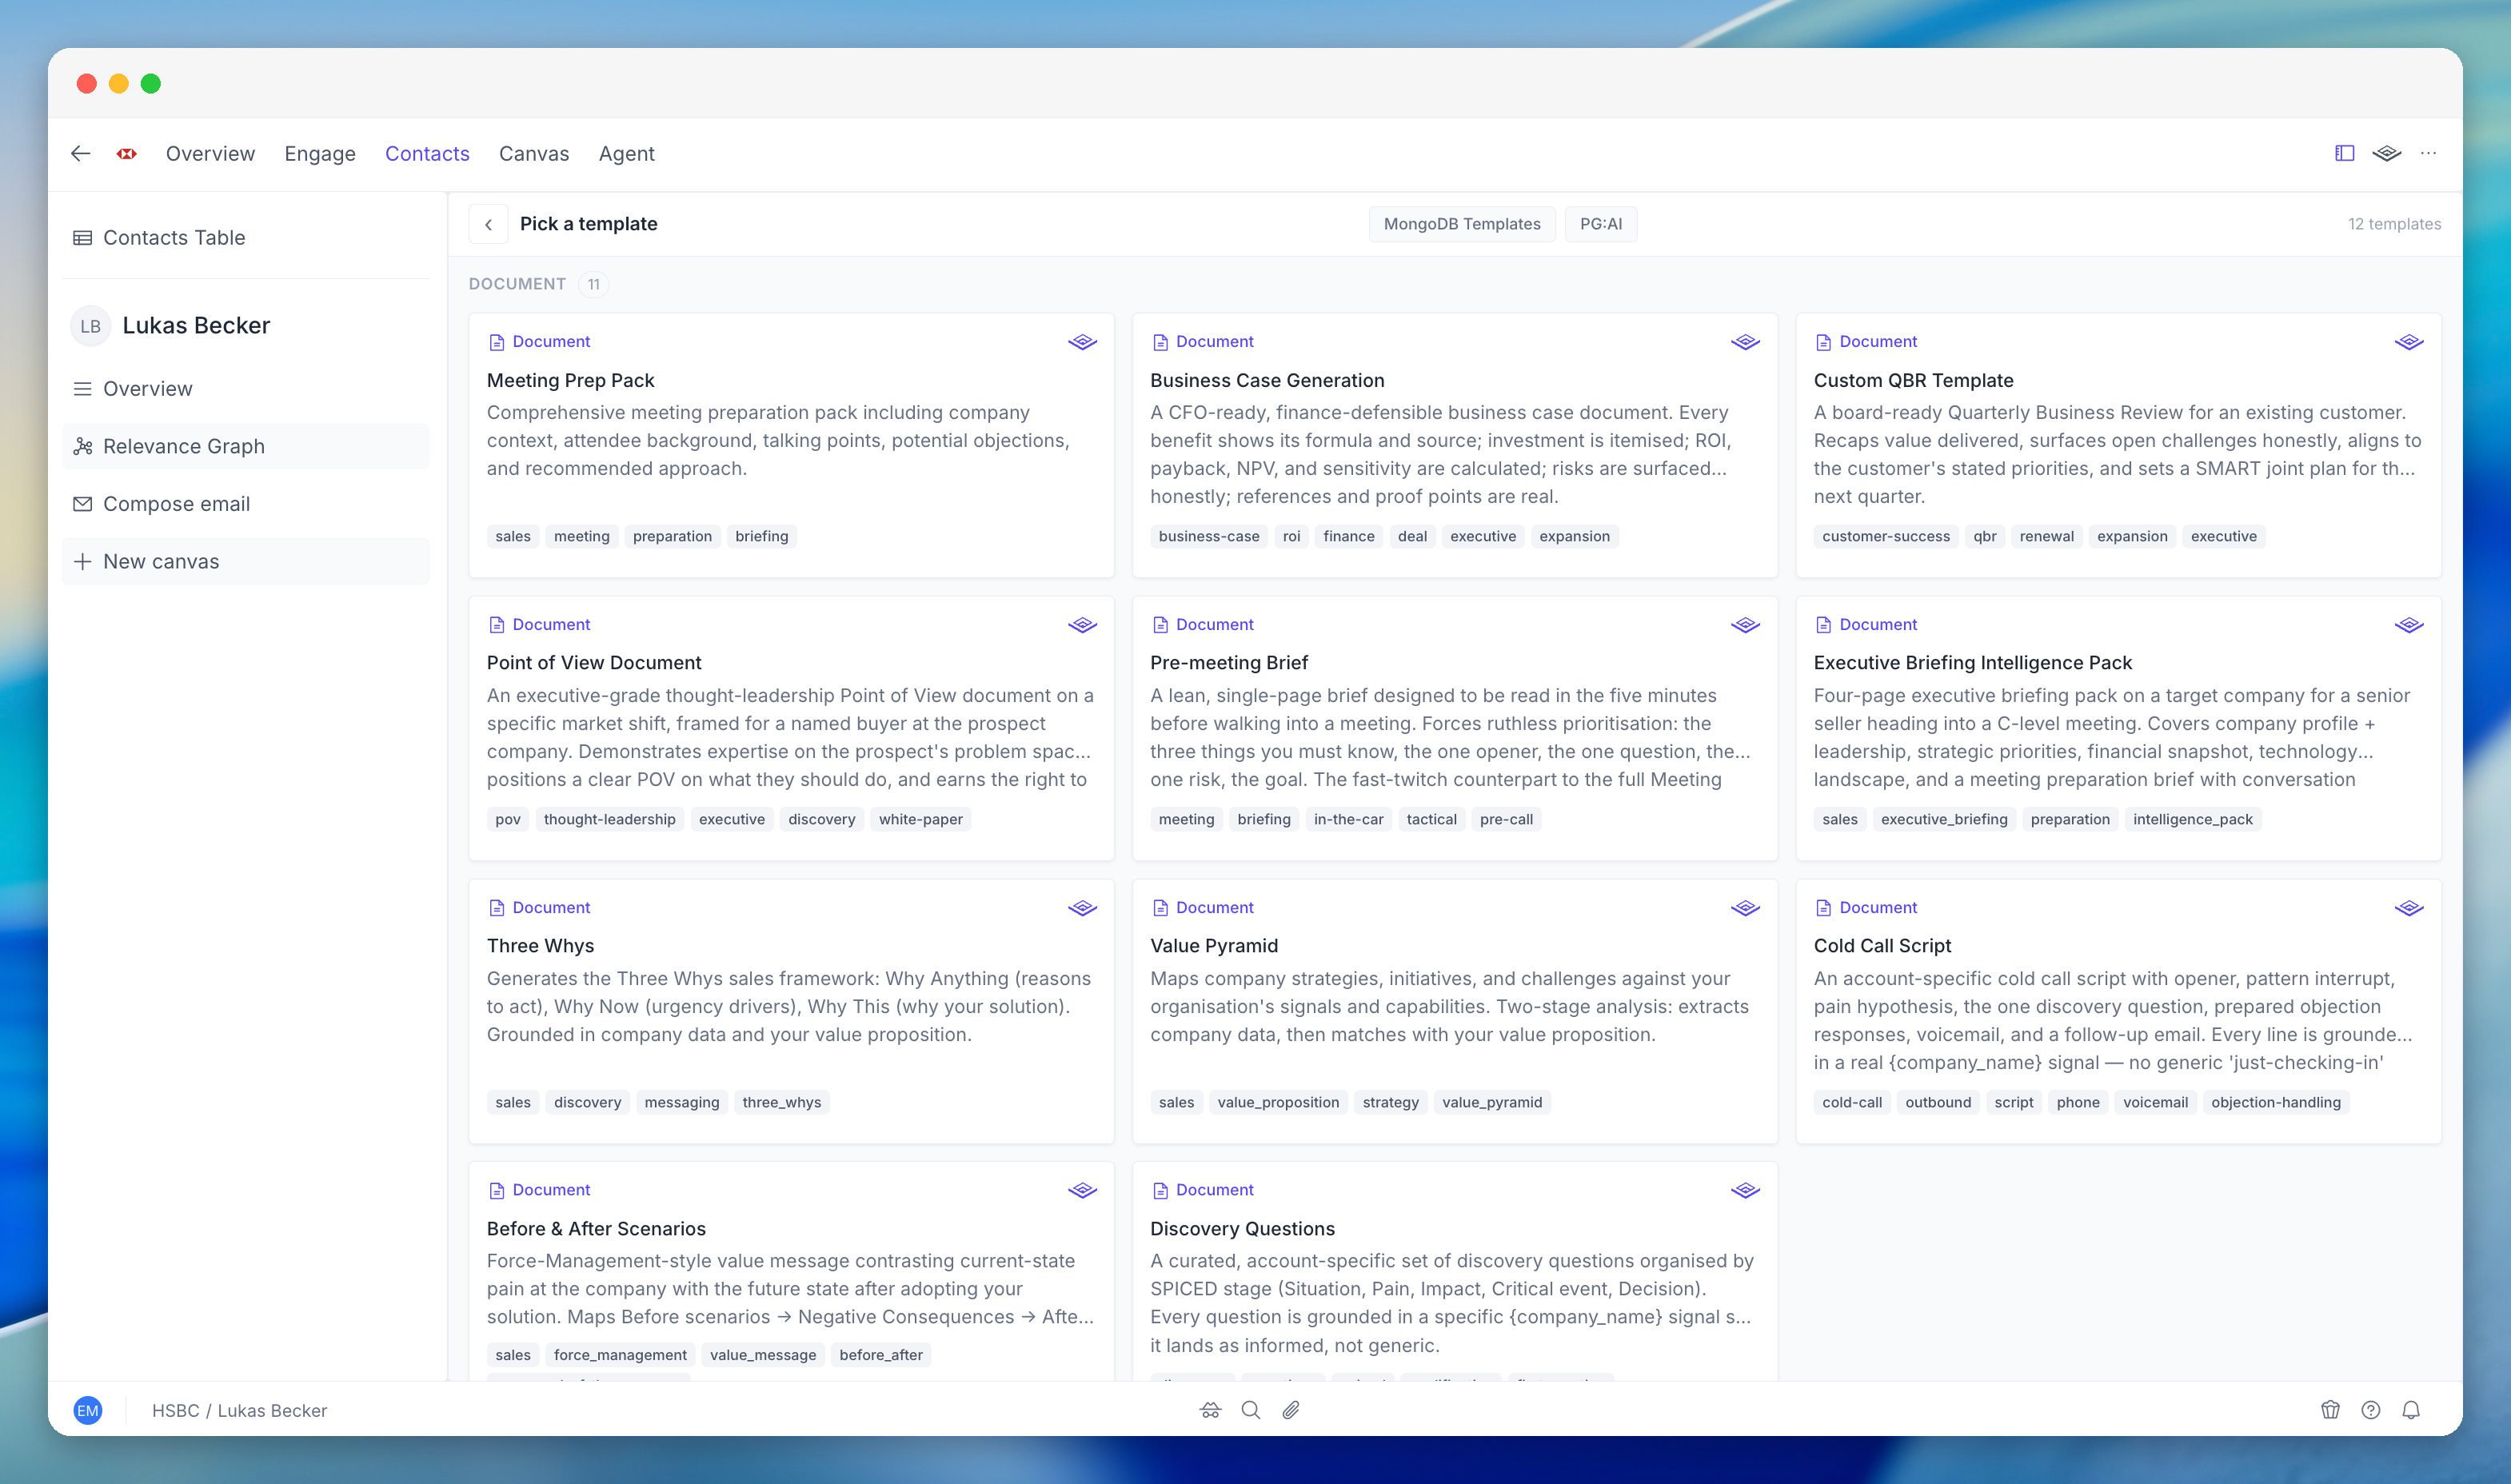
A composable content surface for generating, editing, and refining deliverables. Pick a template or start from scratch. The Agent writes a first draft pre-filled with account intelligence. You refine through conversation: “Make the competitive section stronger.” “Add the CFO’s comments from last quarter.” Each revision draws on the full intelligence graph. Account briefs, meeting prep, email sequences, discovery questions, competitive comparisons, value pyramids. You can use the built-in templates or create your own that your team can reuse.Workflows
Multi-step agentic pipelines that run across accounts at scale. Define a sequence of steps (research, analyse, find contacts, generate outreach) and run it across 50 or 500 accounts at once. Workflows branch, run in parallel, and produce different outputs per step. Build once, run across your entire territory.Territory
The go-to-market planning layer. Score and rank accounts, run AI-powered scenarios, and focus your team on the opportunities that matter most. Instead of static spreadsheets, Territory brings together enriched account data, configurable scoring models, and AI recommendations in one place.Monitoring
Seven agent types run continuously across every account on your watchlist: jobs, contacts, web mentions, annual reports, earnings calls, public filings, and strategic insight changes. When something changes, monitoring doesn’t just notify you. It contextualises the signal, explains why it matters, and tells you what to do about it. Signals are ranked by relevance, not just recency. A new VP of Engineering doesn’t show up as “new contact detected.” The alert maps their background to your solution and your buyer personas. Alerts can trigger Studio workflows automatically.Workspace
The cross-account layer of PG:AI. While Account gives you deep intelligence on a single company and Territory helps you prioritise, Workspace lets you search, explore, and monitor activity across your entire portfolio from one place.Unified Search
One search box for every piece of intelligence across all your accounts. Insights, contacts, jobs, public events, news mentions, web pages, technologies, internal documents, and conversations, all queryable from one place. Unified Search understands the meaning of your query and ranks results by relevance, not just keyword match. Instead of remembering which tab or system holds what, you type what you’re looking for and get the answer. The same search engine powers single-company timelines, dashboards, and the global search bar. Three scopes: a single account, your tracked book of business, or every account in your entire organisation. Three views: timeline (most recent first), company (grouped by account), and relevance graph (visual network showing how accounts and topics connect).Activity Pulse
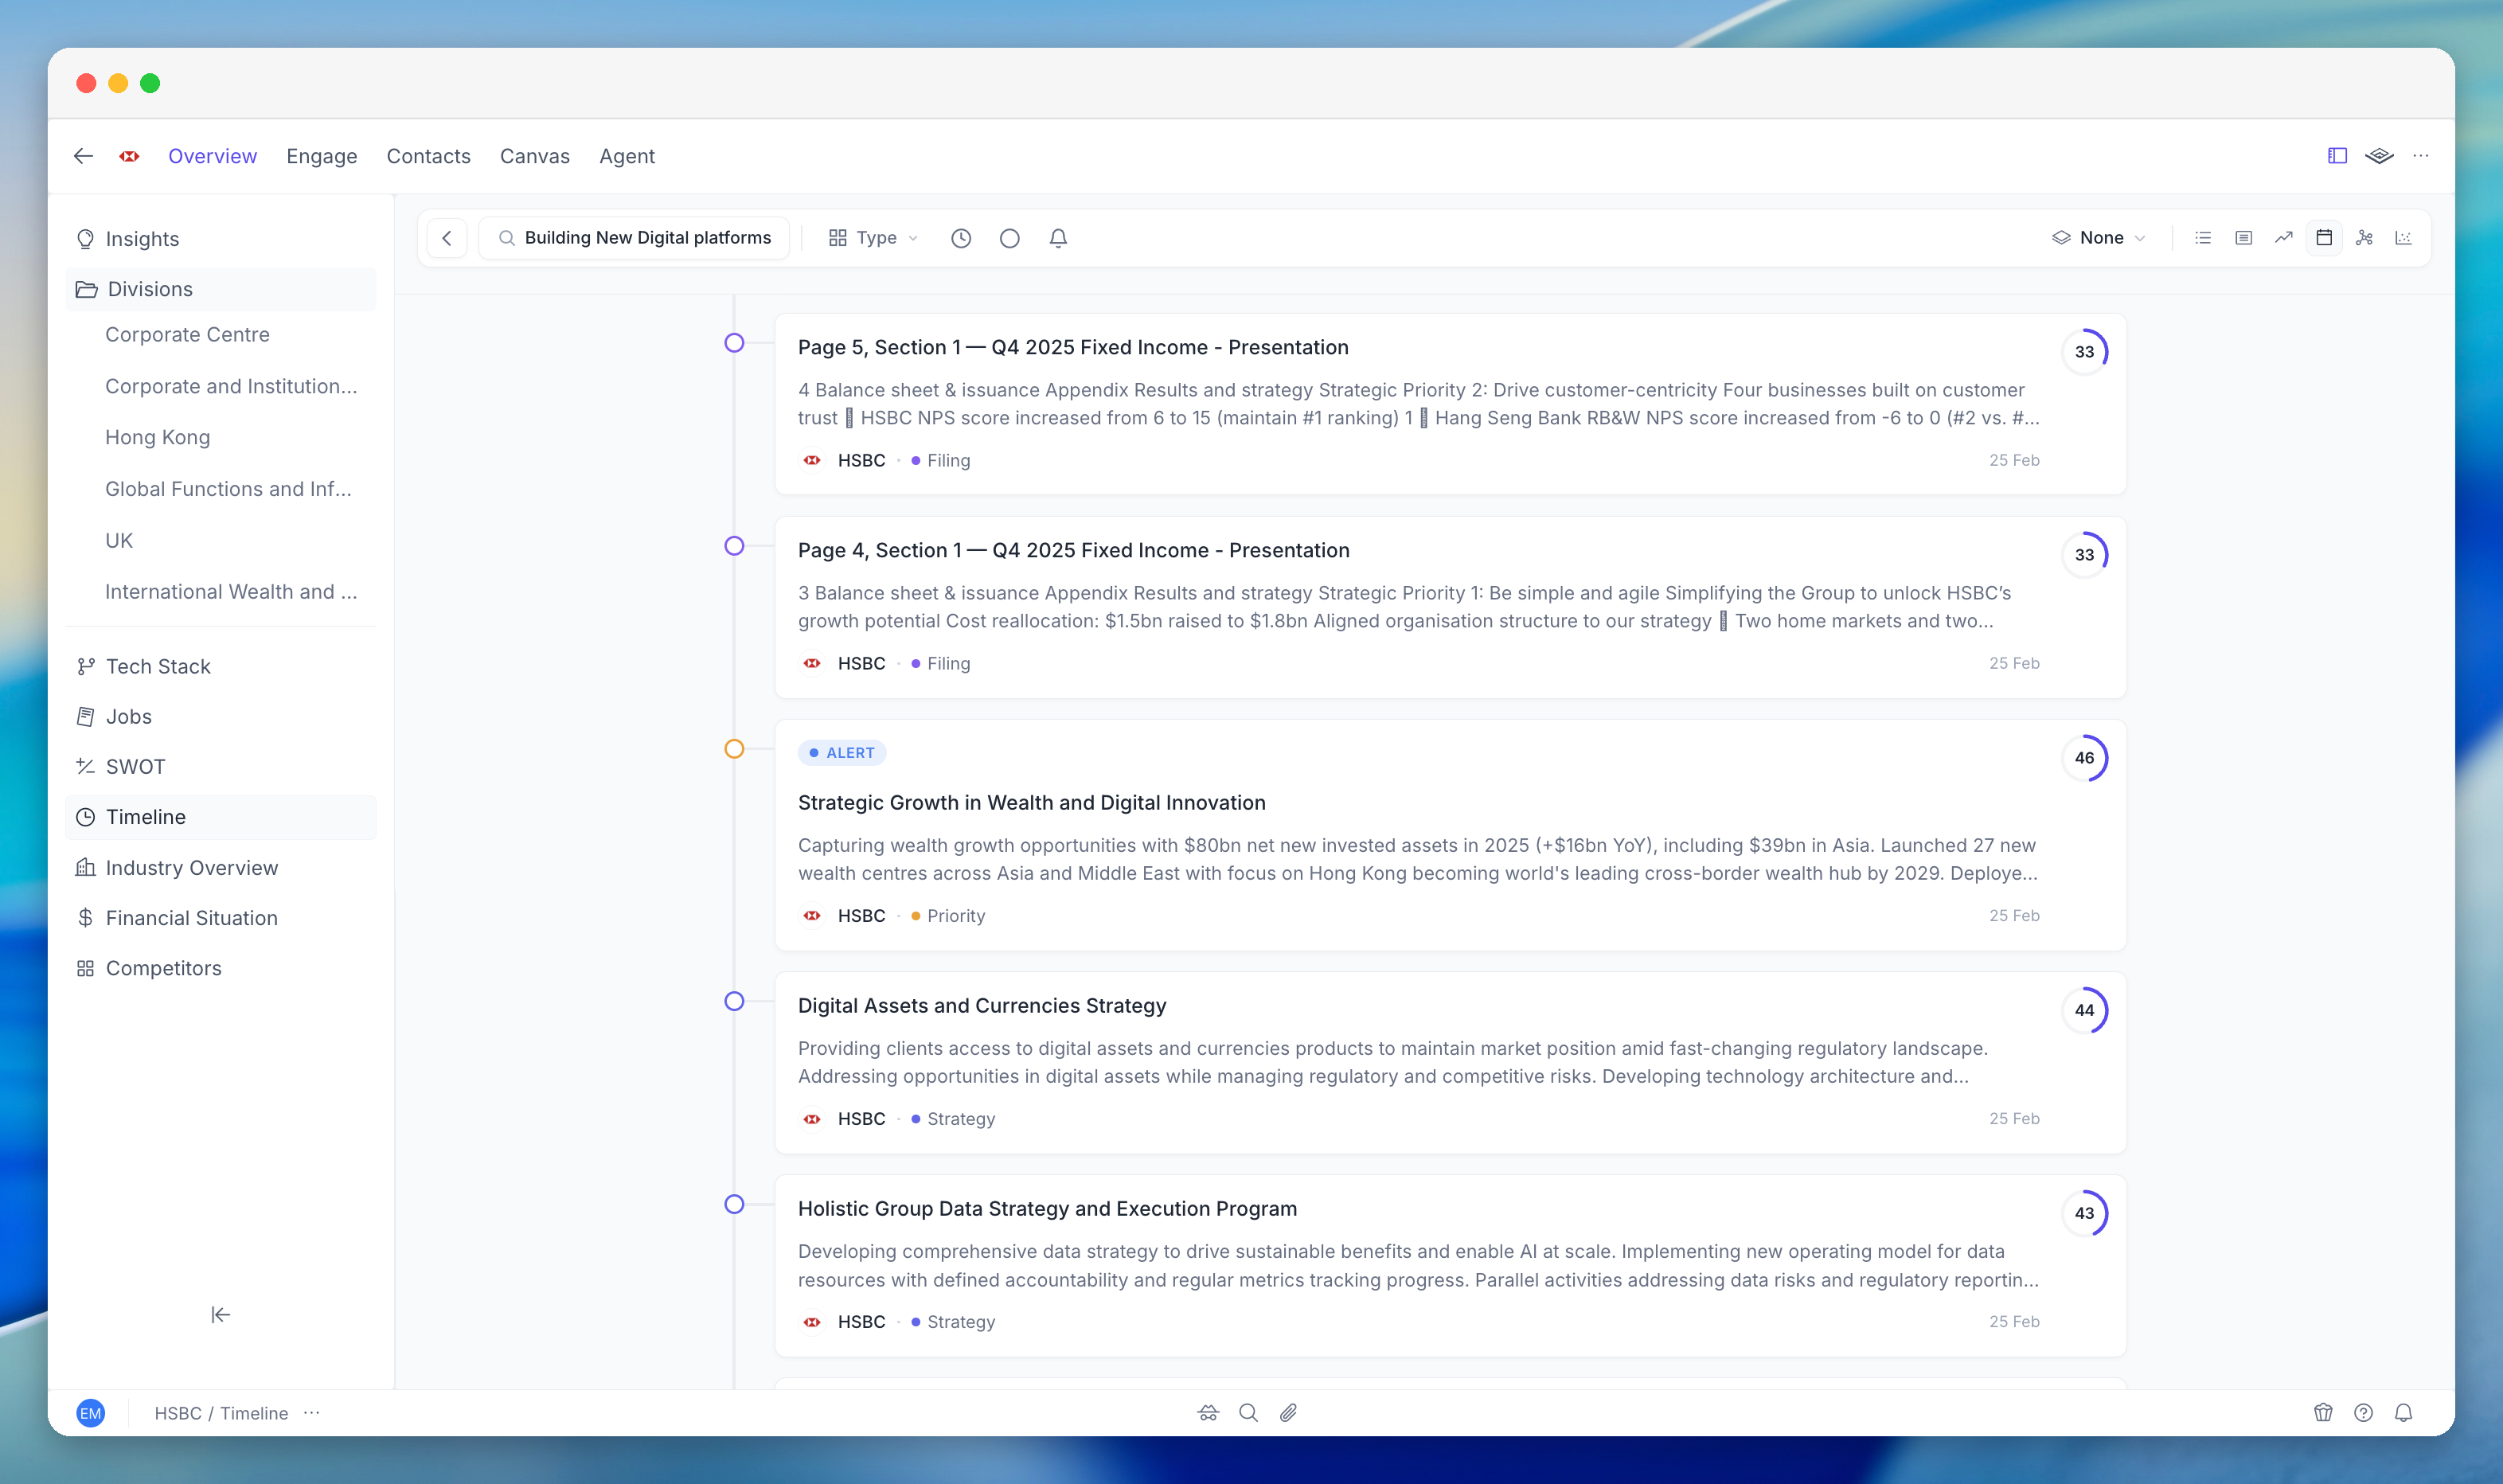
The dashboard sellers open first thing in the morning. Activity Pulse brings together every meaningful event from every account, strategic priorities, earnings calls, leadership changes, hiring activity, technology adoption, news mentions, and regulatory filings, so you can see what needs attention today. Built-in weighting ensures high-signal events stand out from routine noise. A new strategic priority from an earnings call reads differently from a standard job posting. A company posting a thousand jobs in a week won’t drown out three earnings-call insights from the same period. You don’t need to configure it. Activity Pulse understands which events matter most and surfaces them accordingly.Contacts
Enhanced discovery
Better contact discovery with more sources and higher match rates.
Phone & email enrichment
Direct phone numbers and verified email addresses, enriched automatically.
Org charts
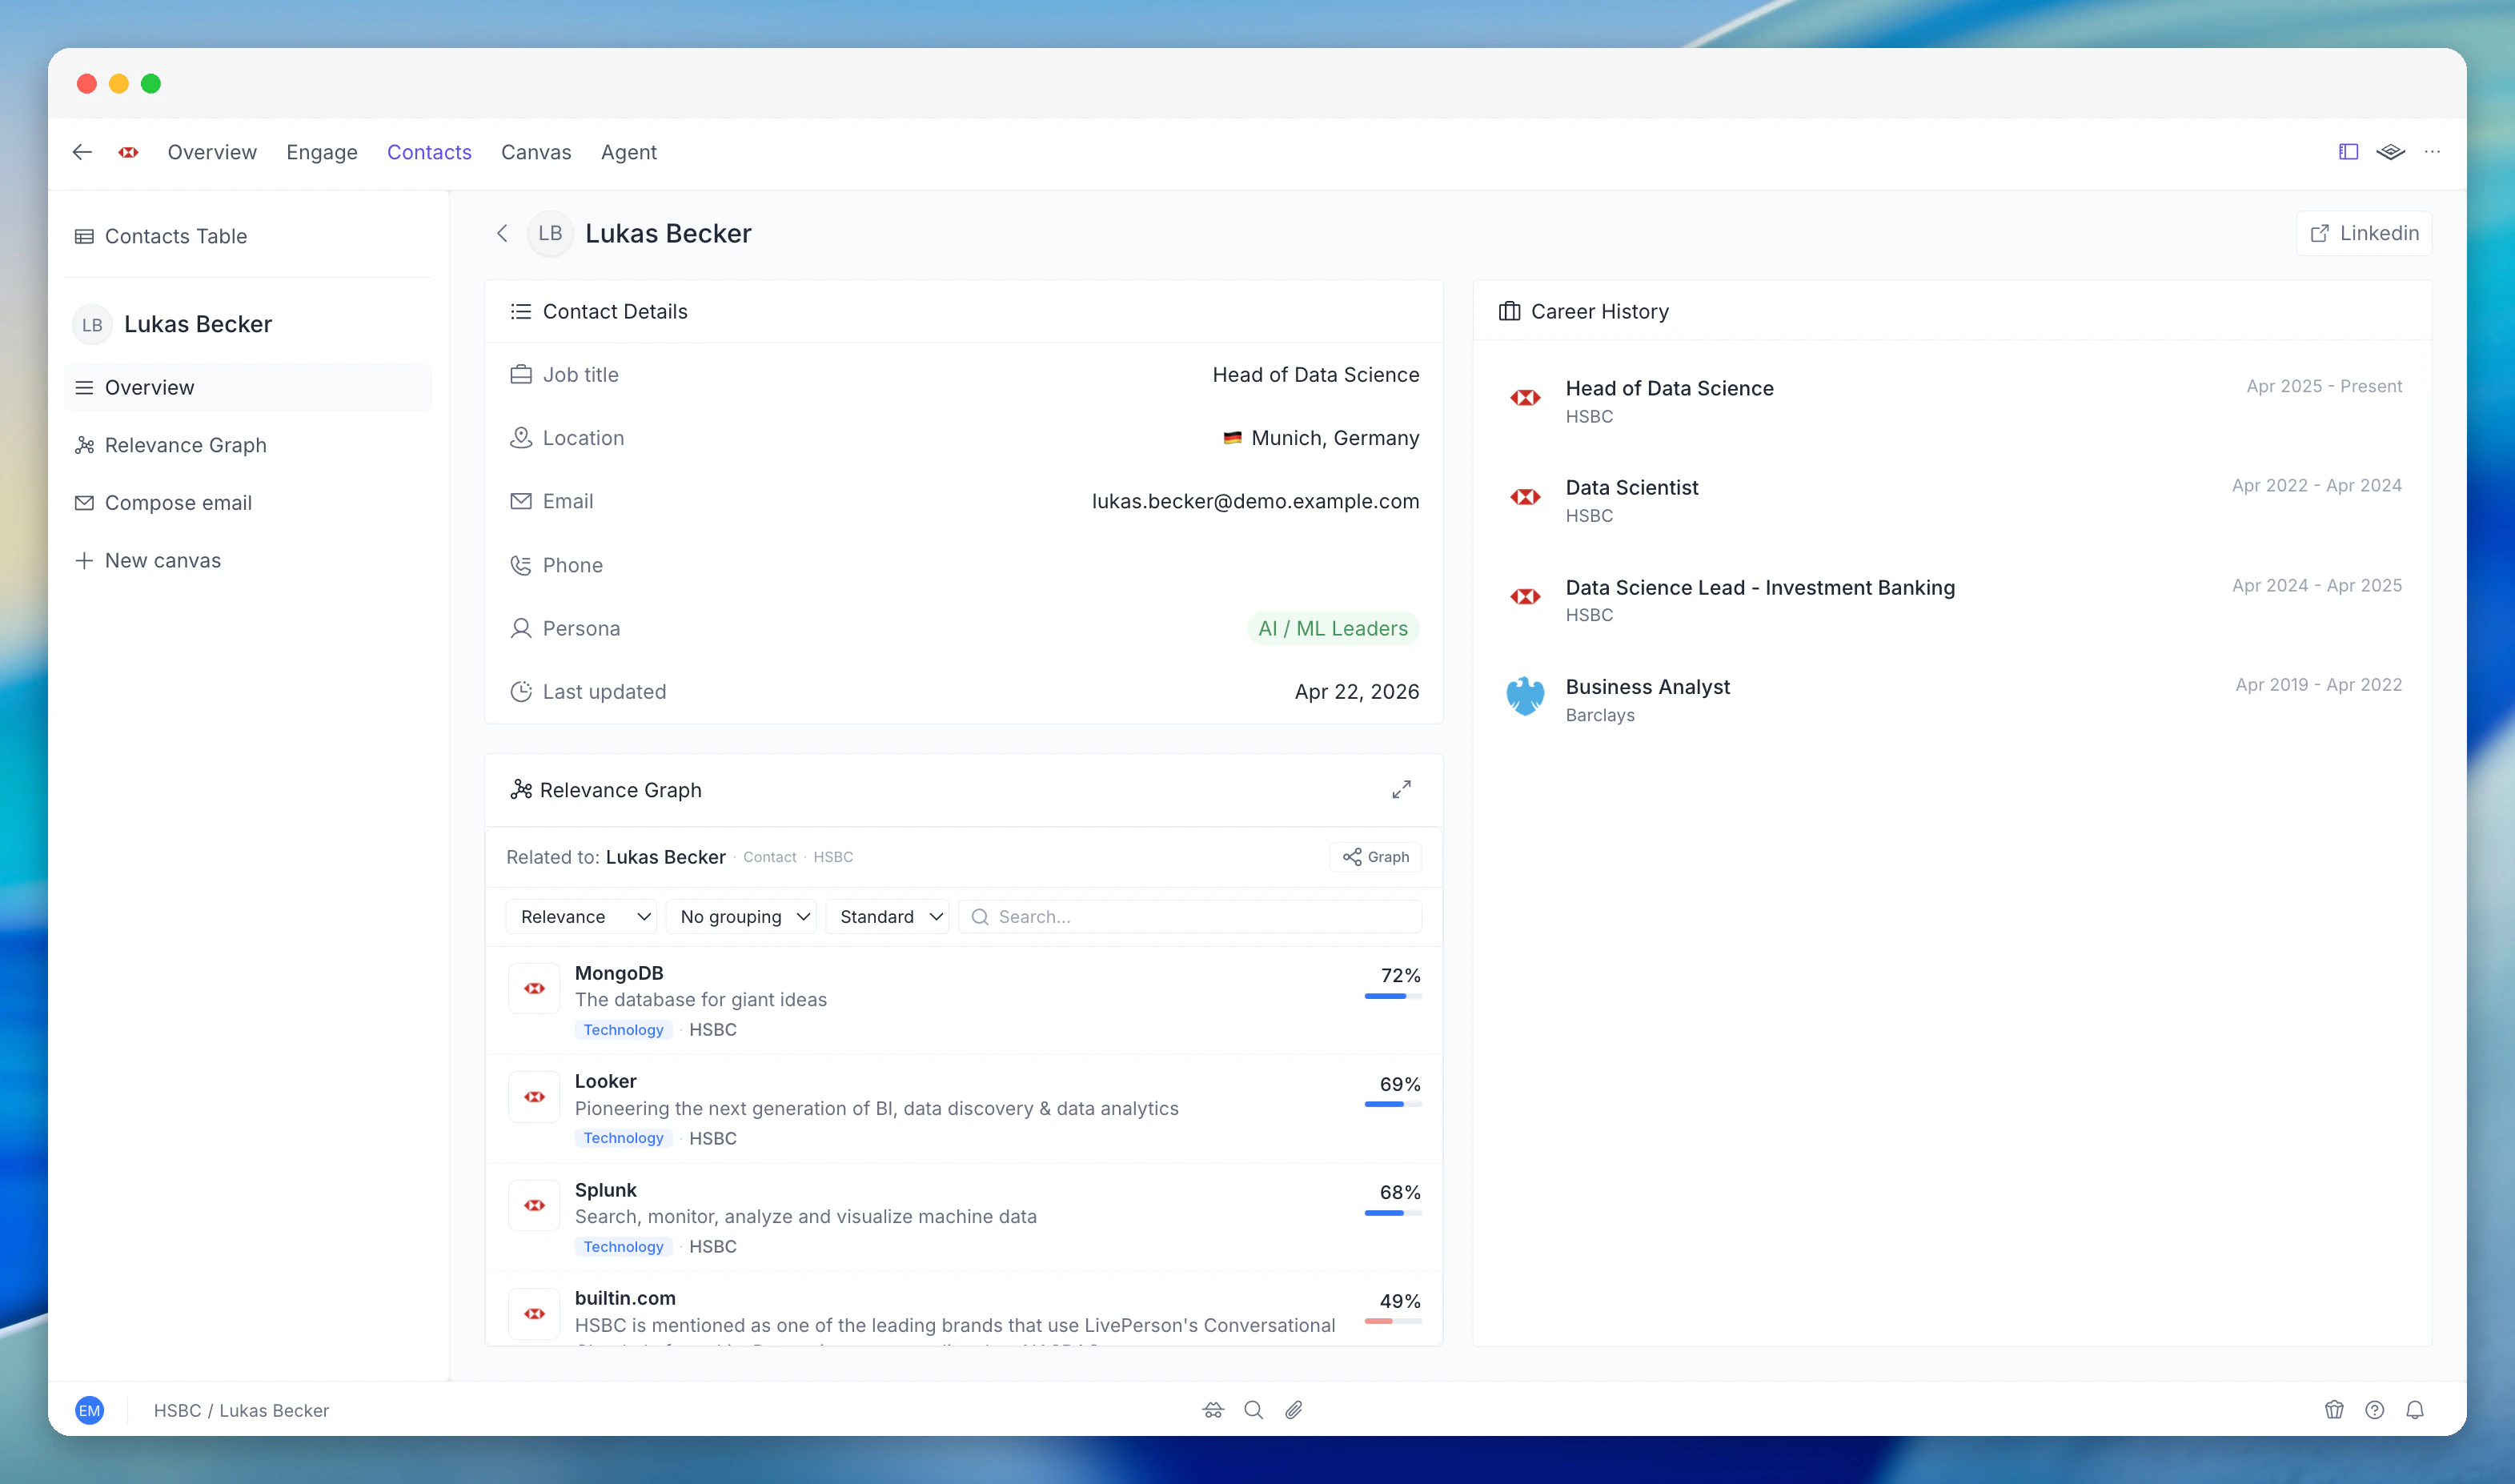
Visual org charts showing reporting lines and team structures, built from enrichment data.
Contact monitoring
Track job changes, promotions, and departures for key contacts across your accounts.
Faster enrichment
Account enrichment is 3-4x faster. What used to take 5-10 minutes now completes in 2-3. The underlying pipeline parallelises research across data sources, so you’re waiting less and working sooner.New interface
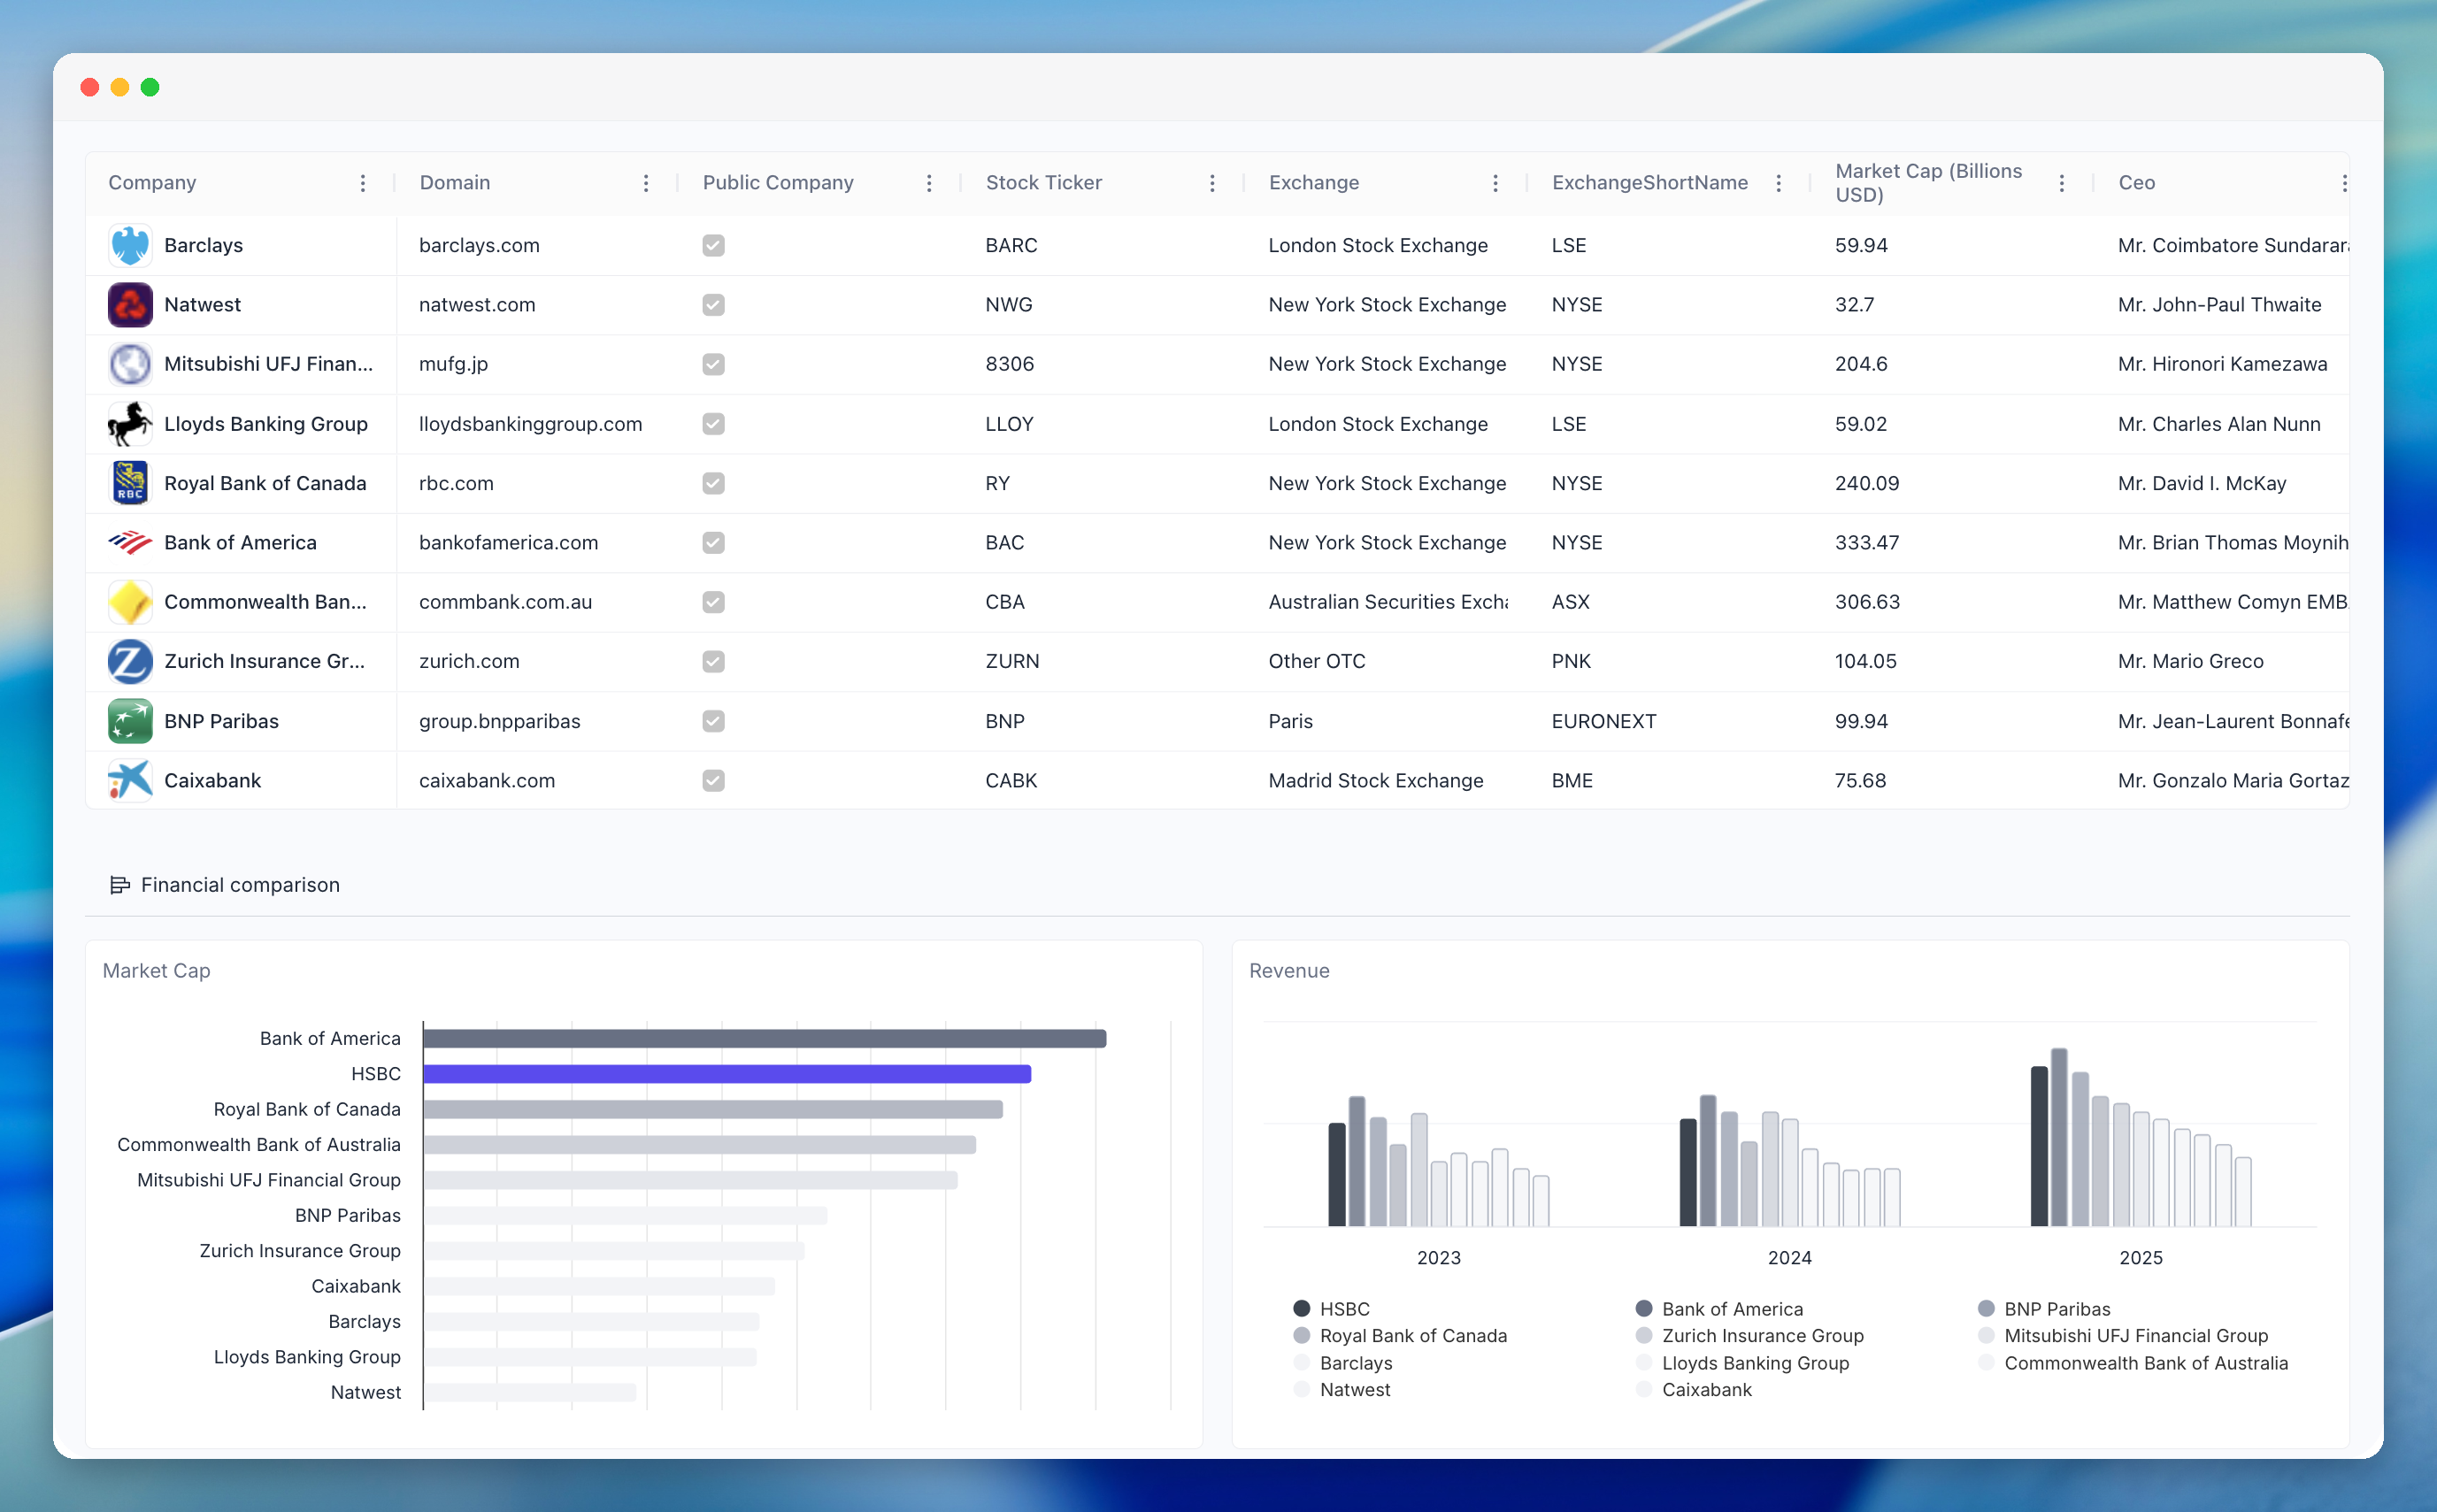
A completely new UI that’s faster to navigate and better to look at. The company view retains the same structure you’re used to, but surfaces more data in a cleaner layout.Product tour - scroll sideways to preview the new interface
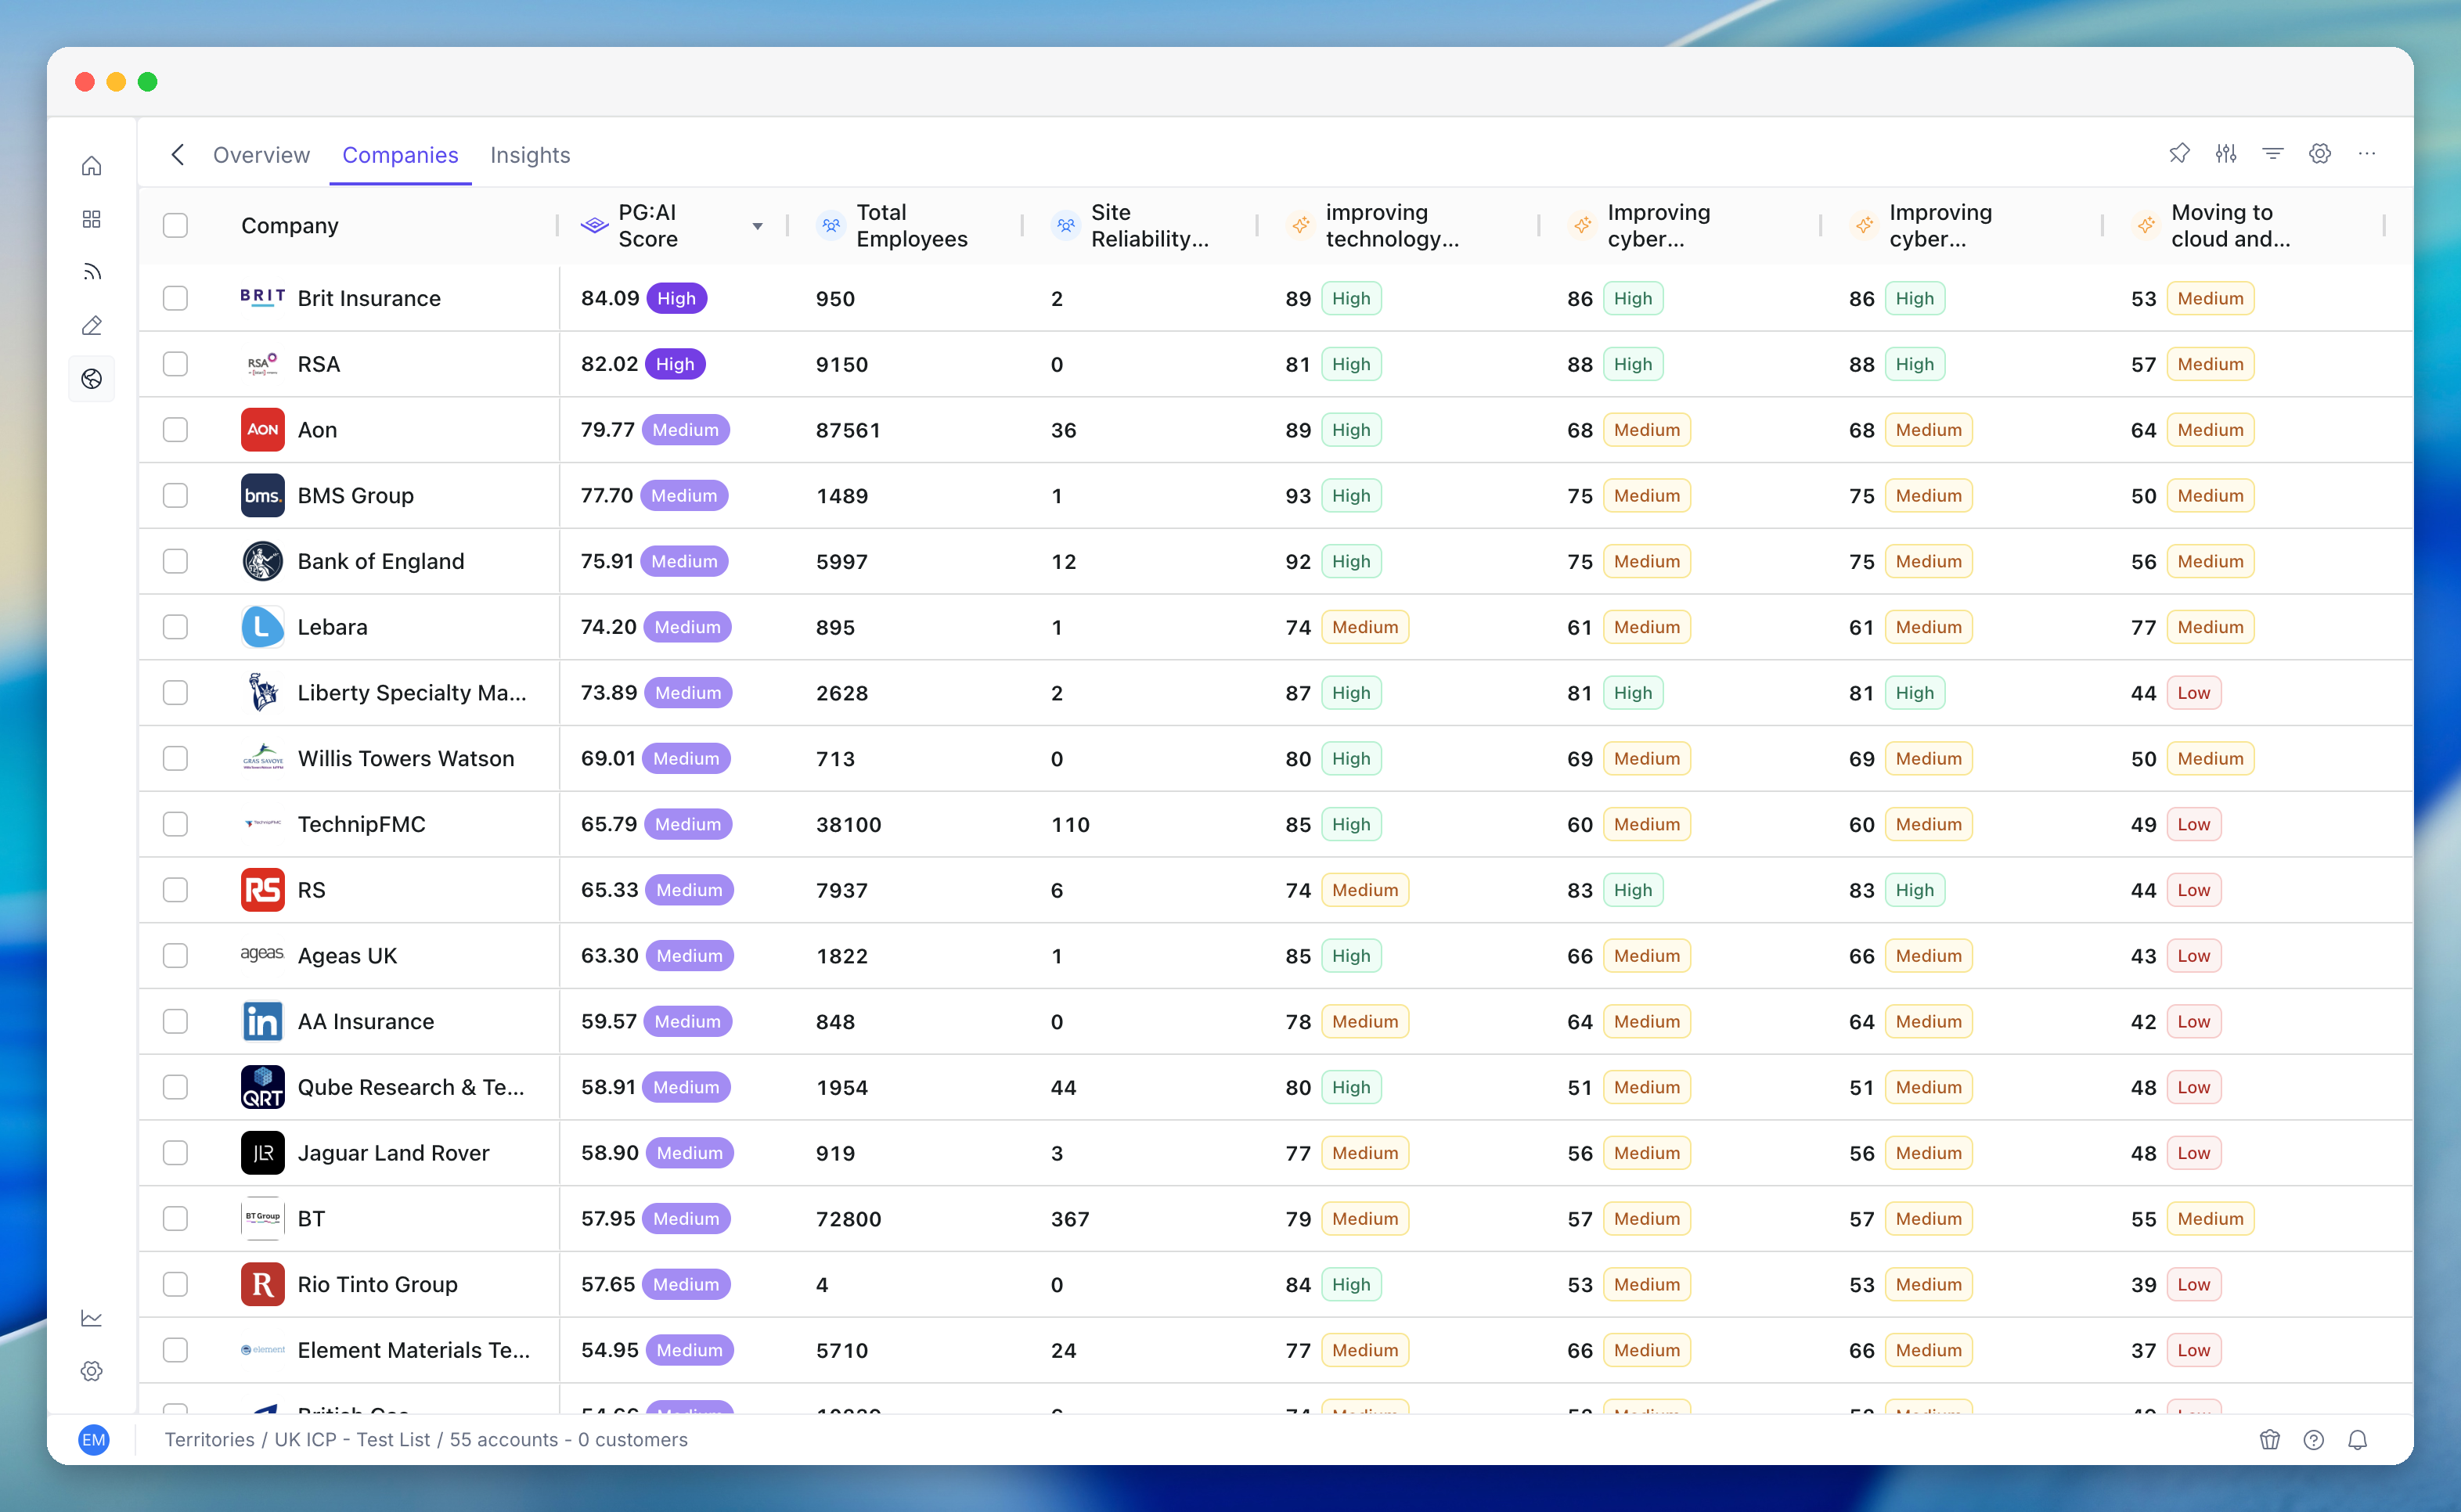
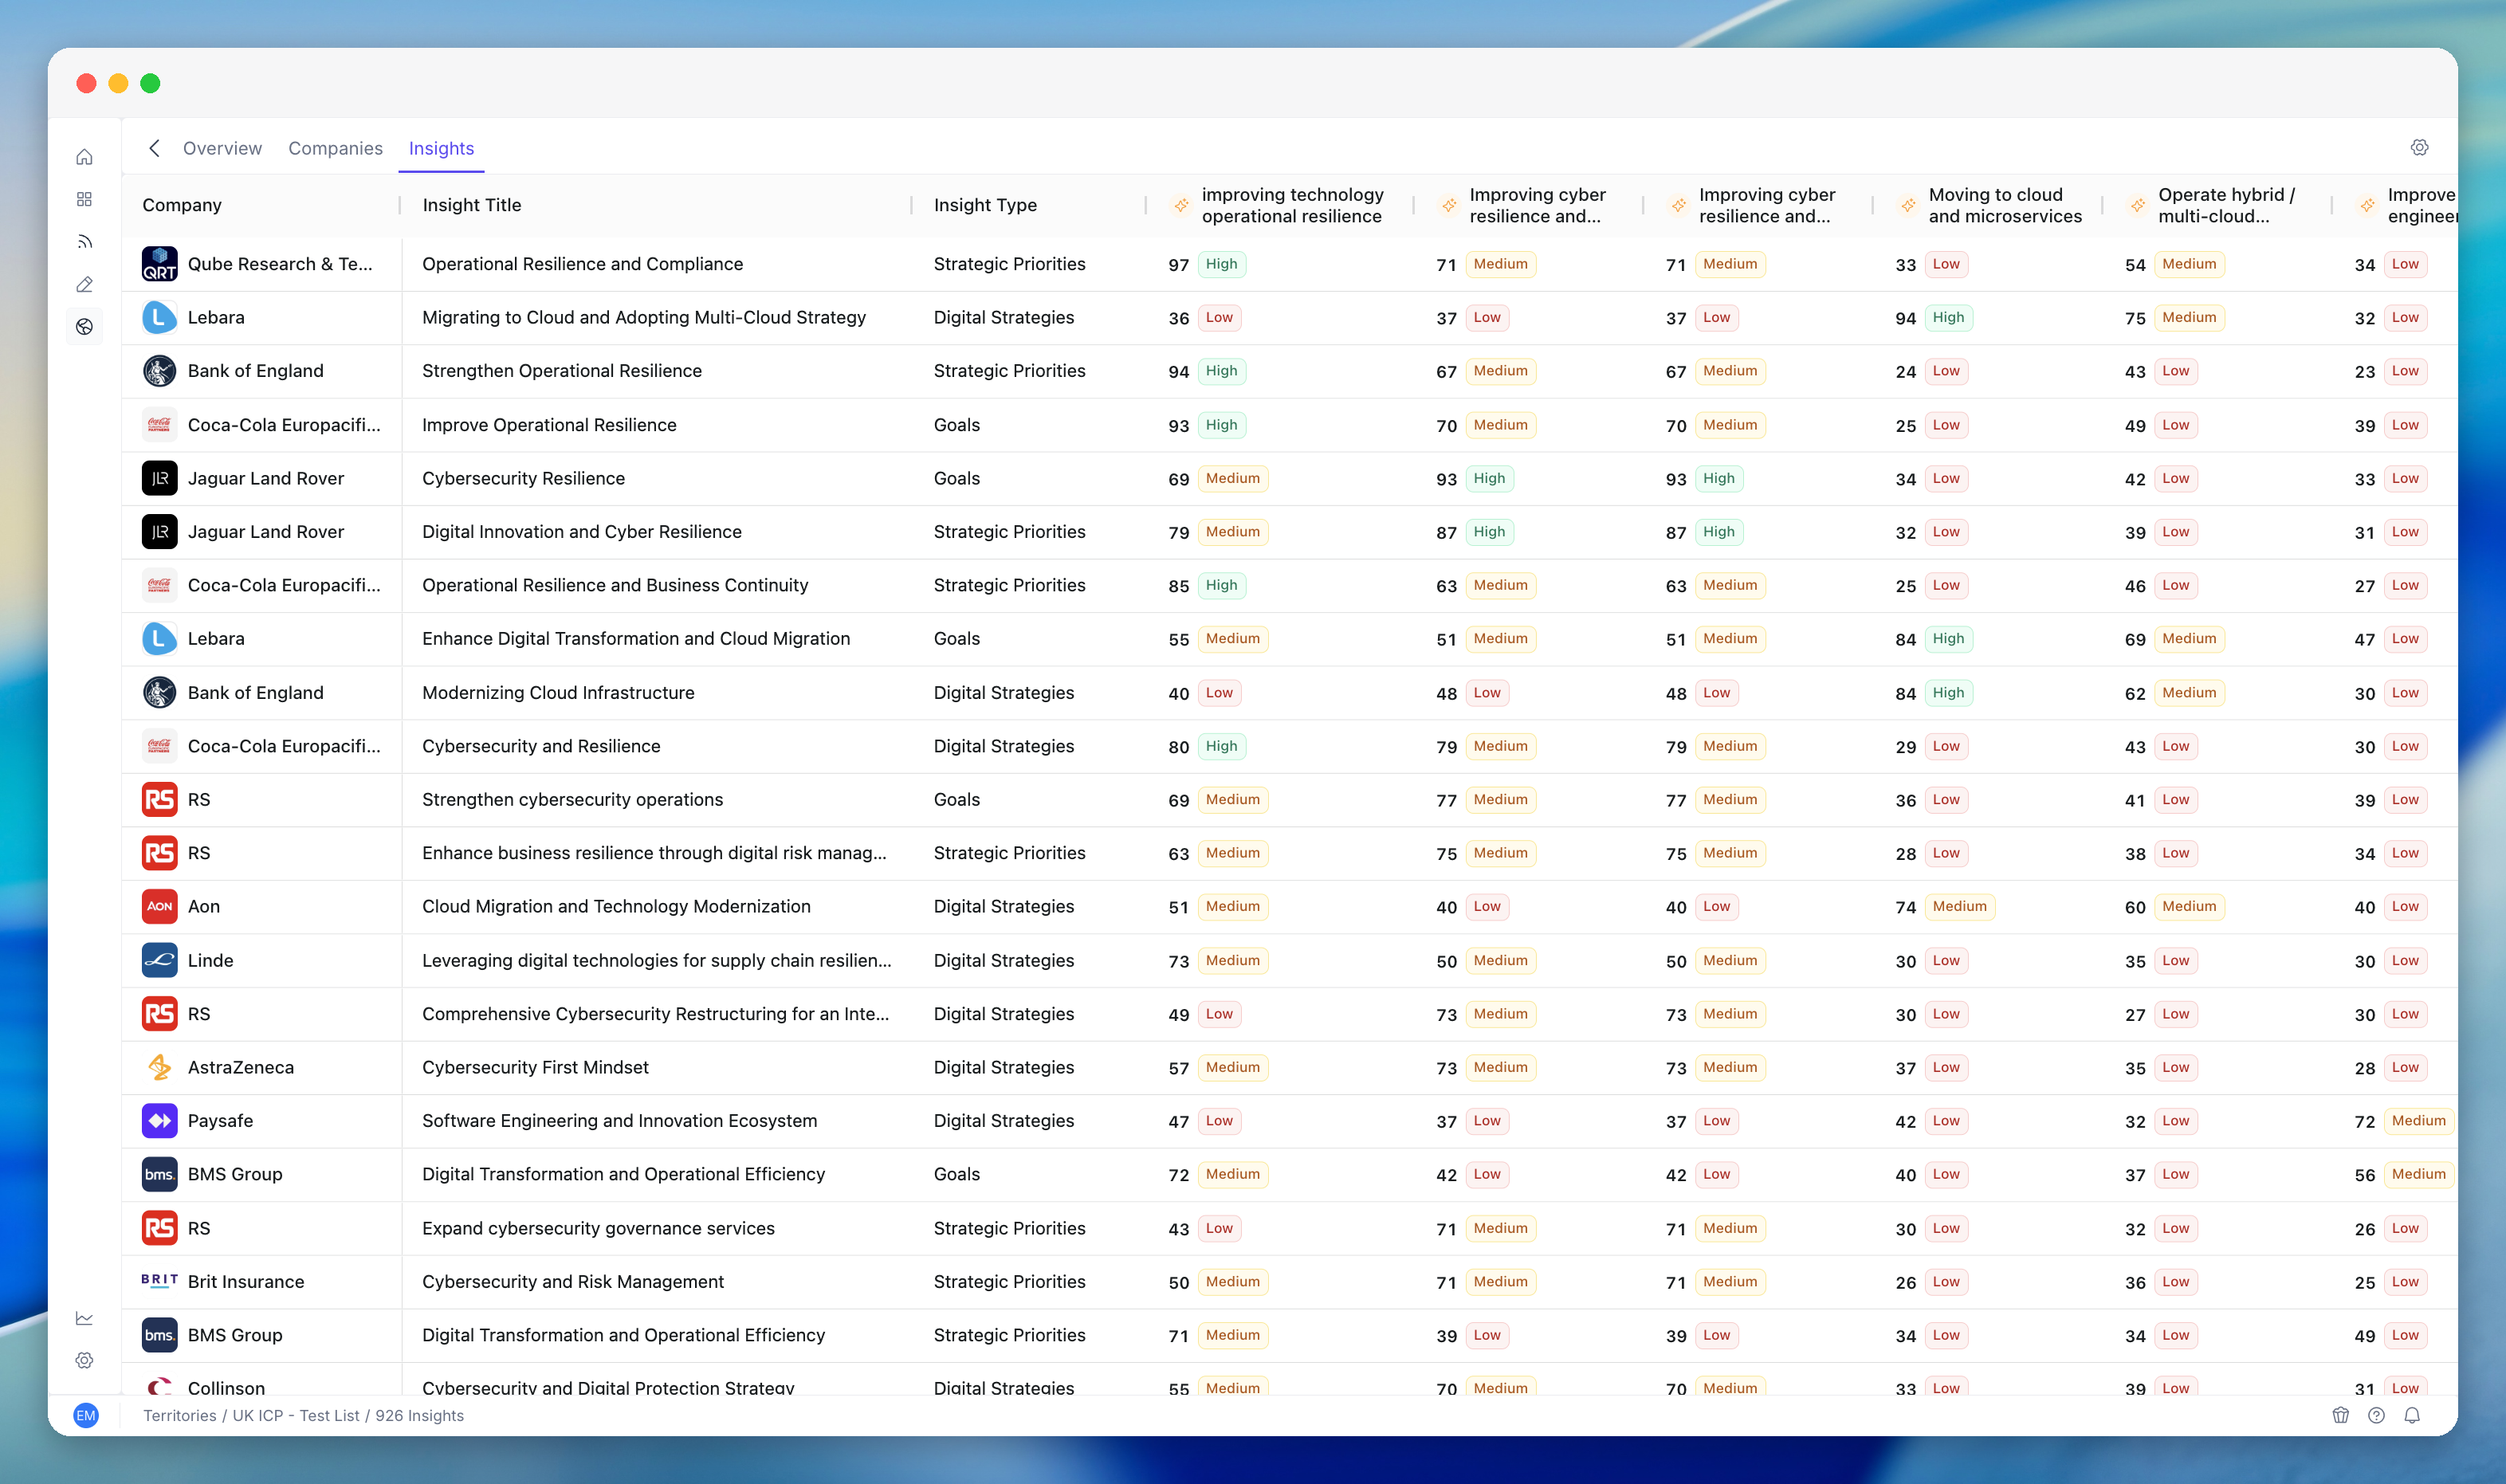
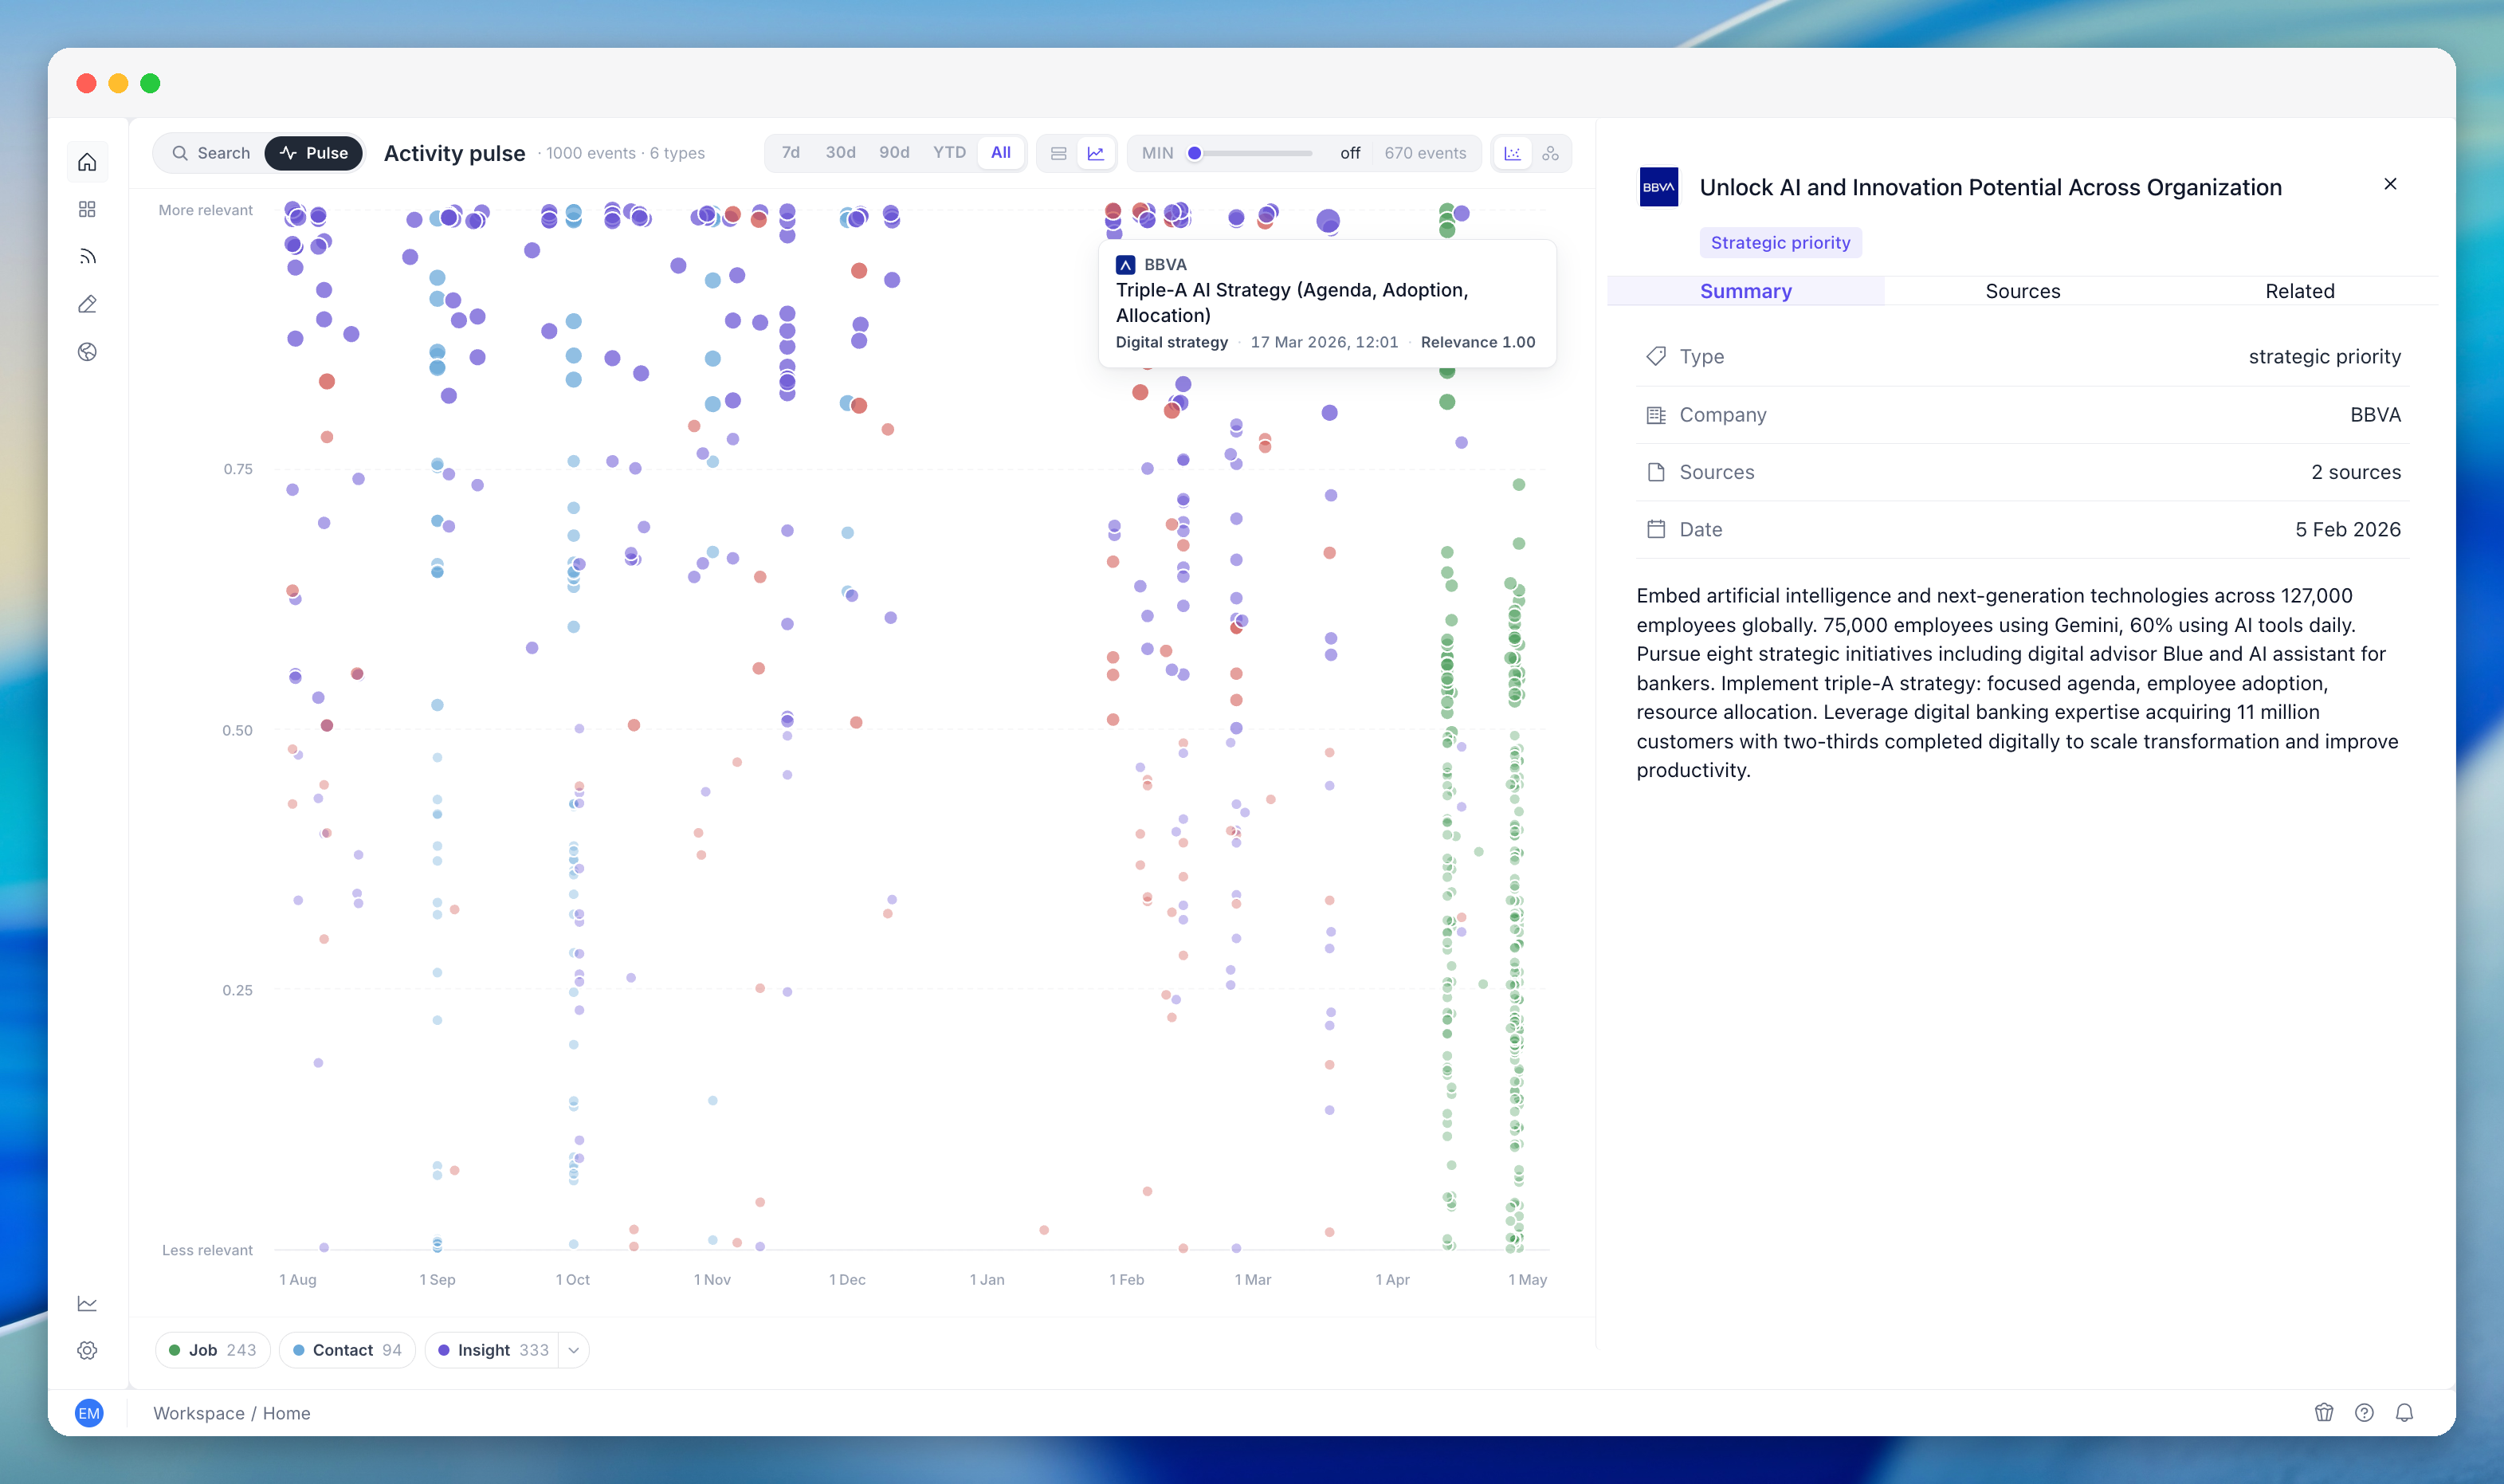
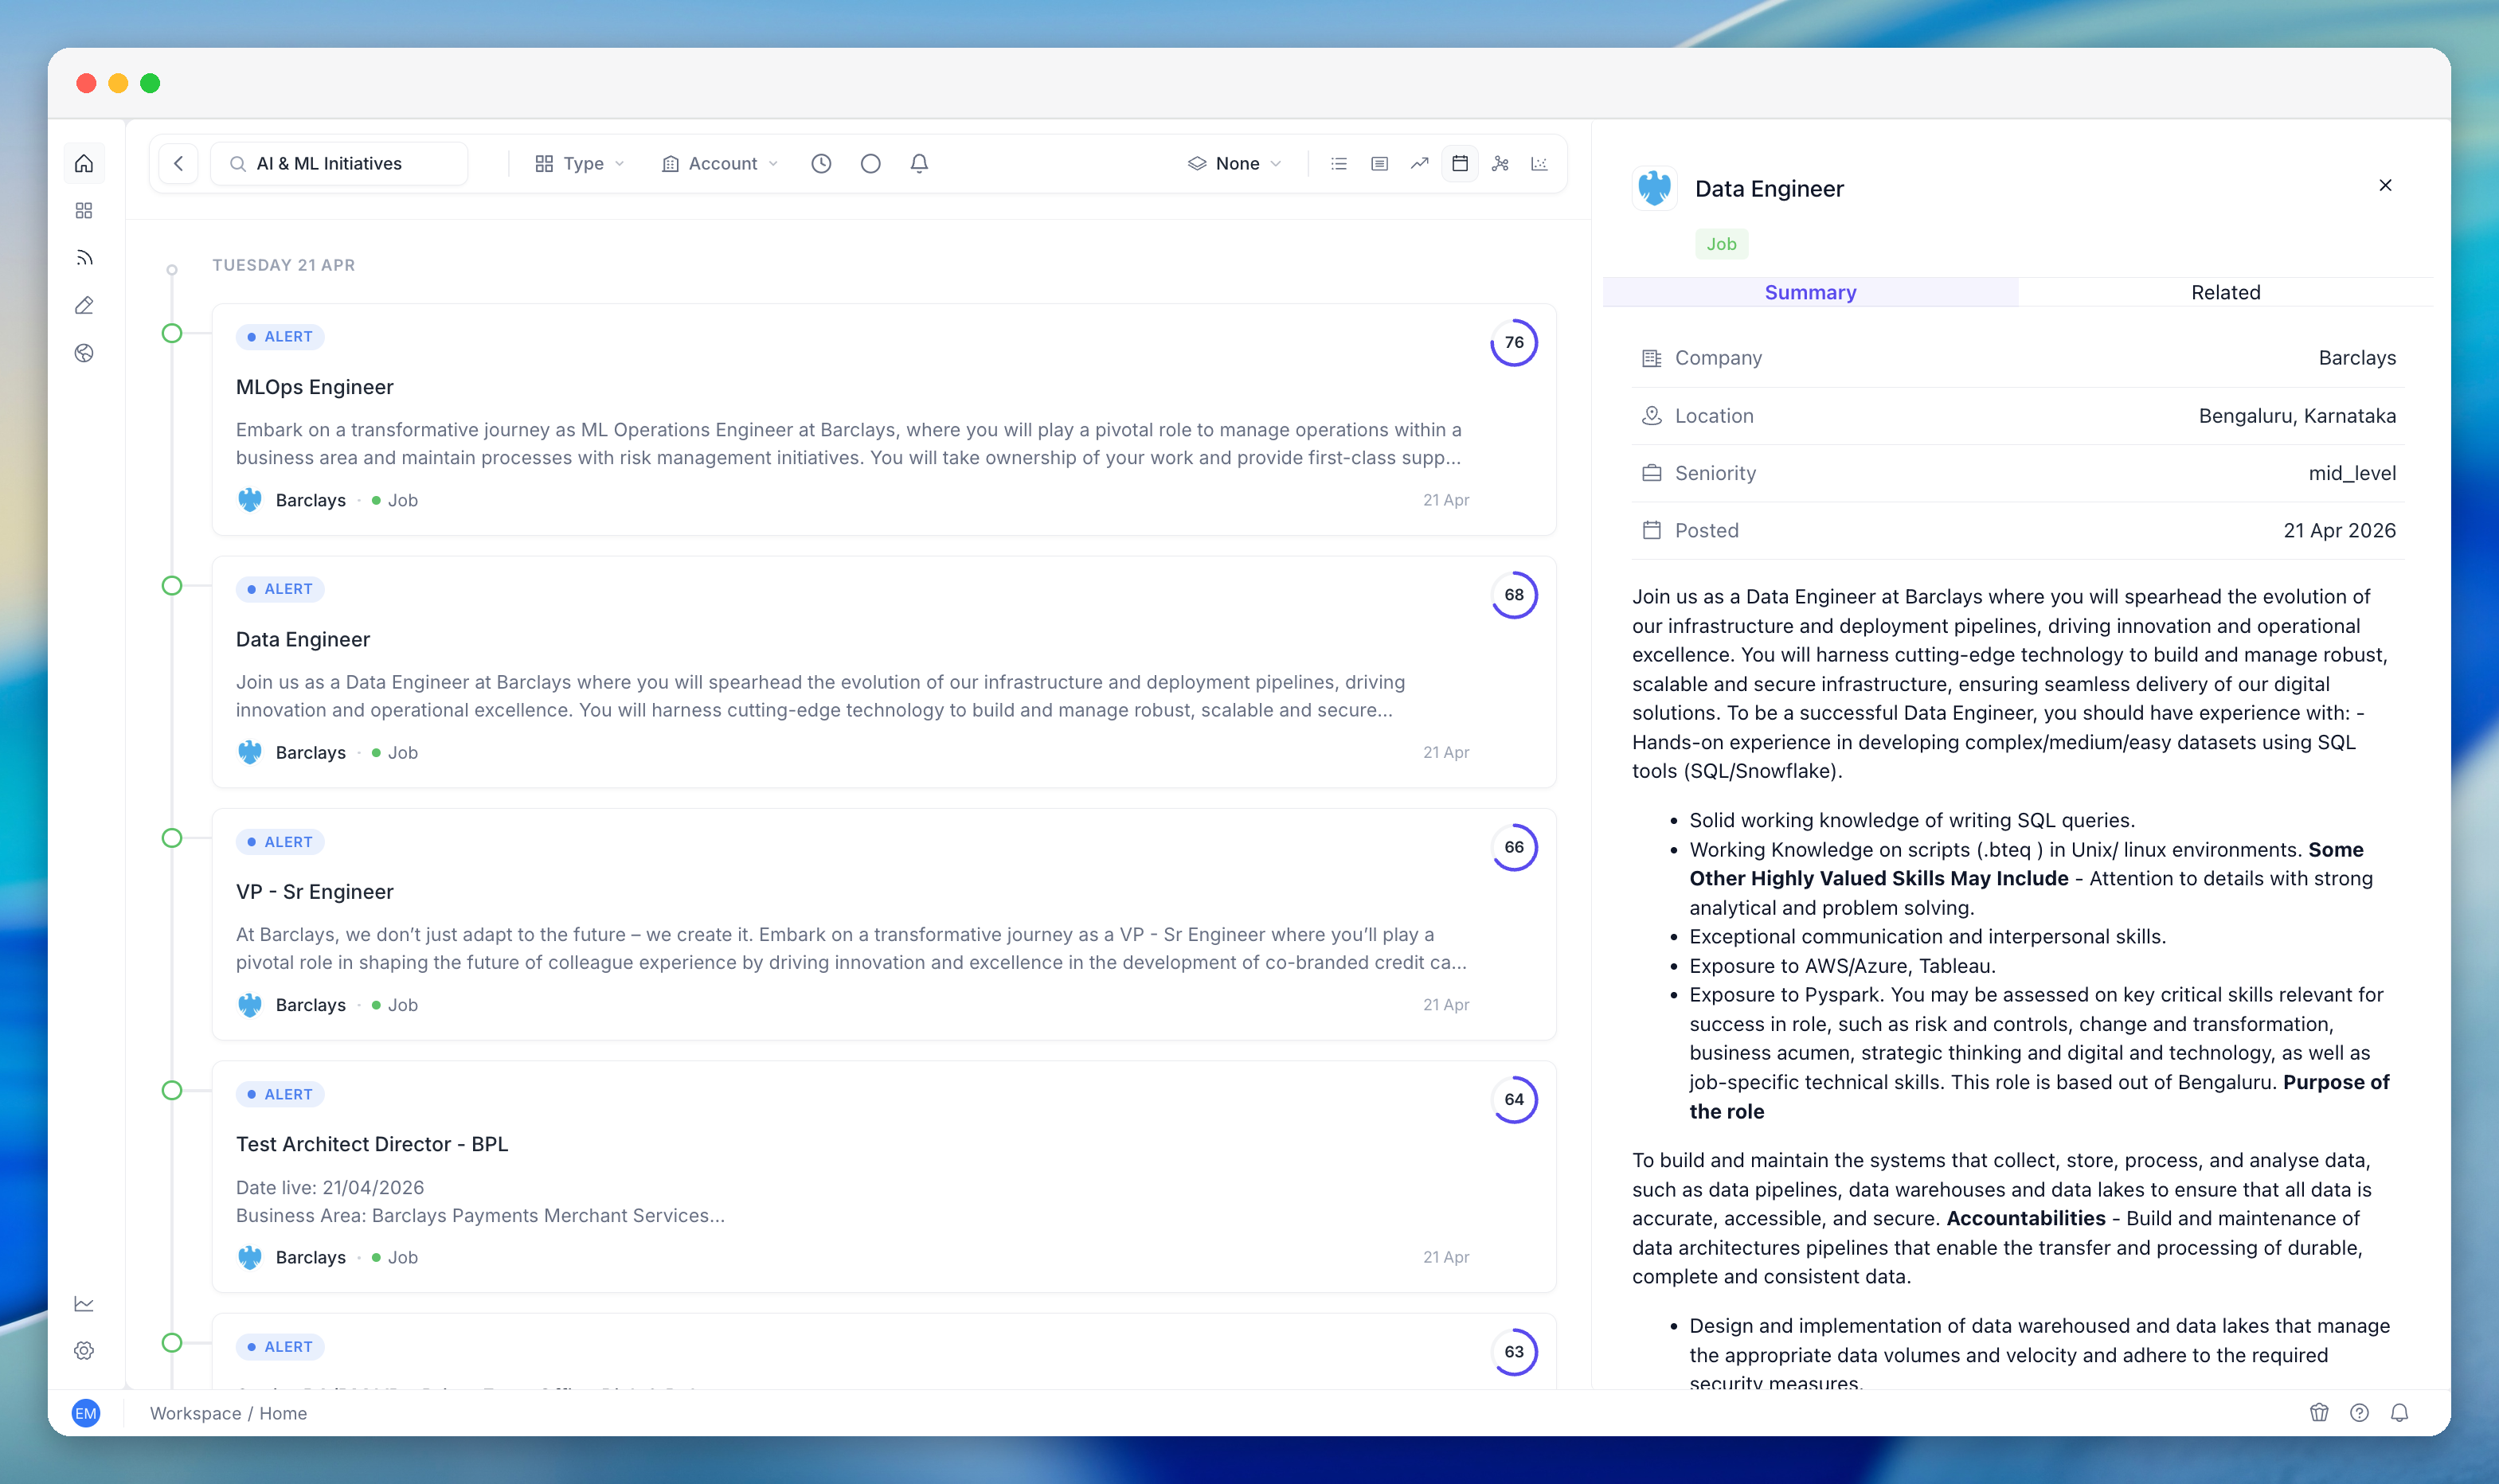
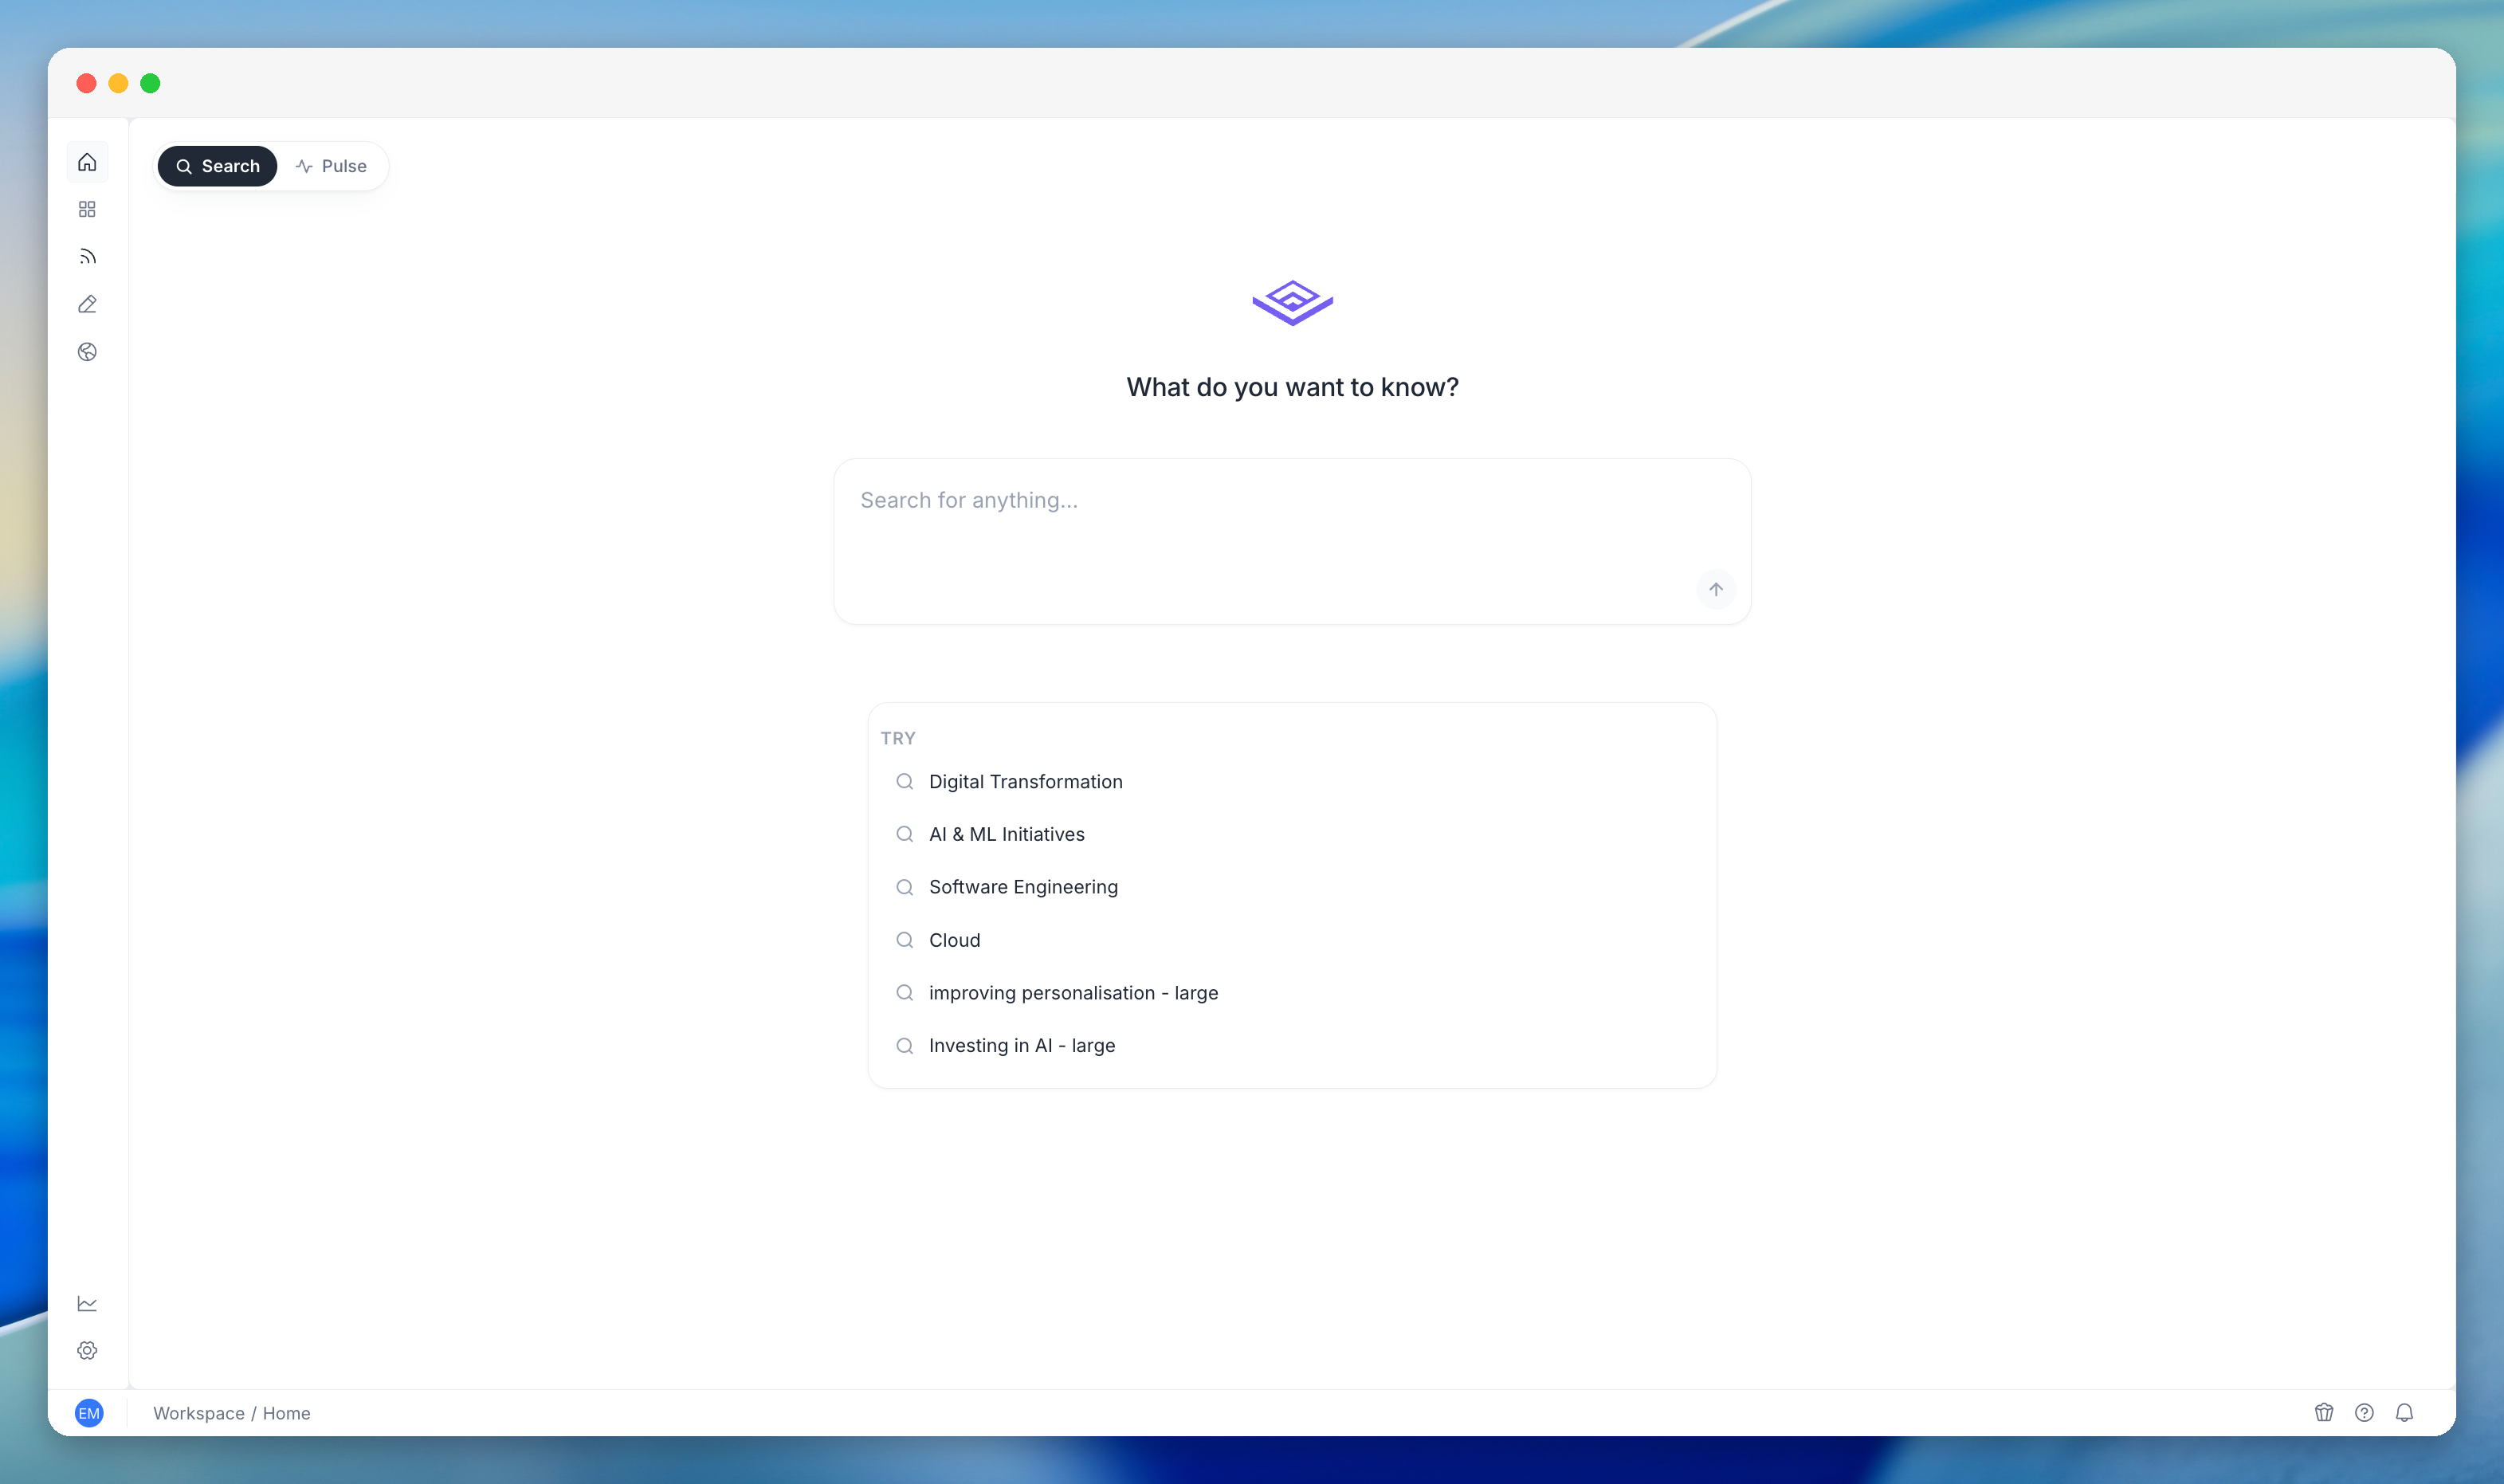
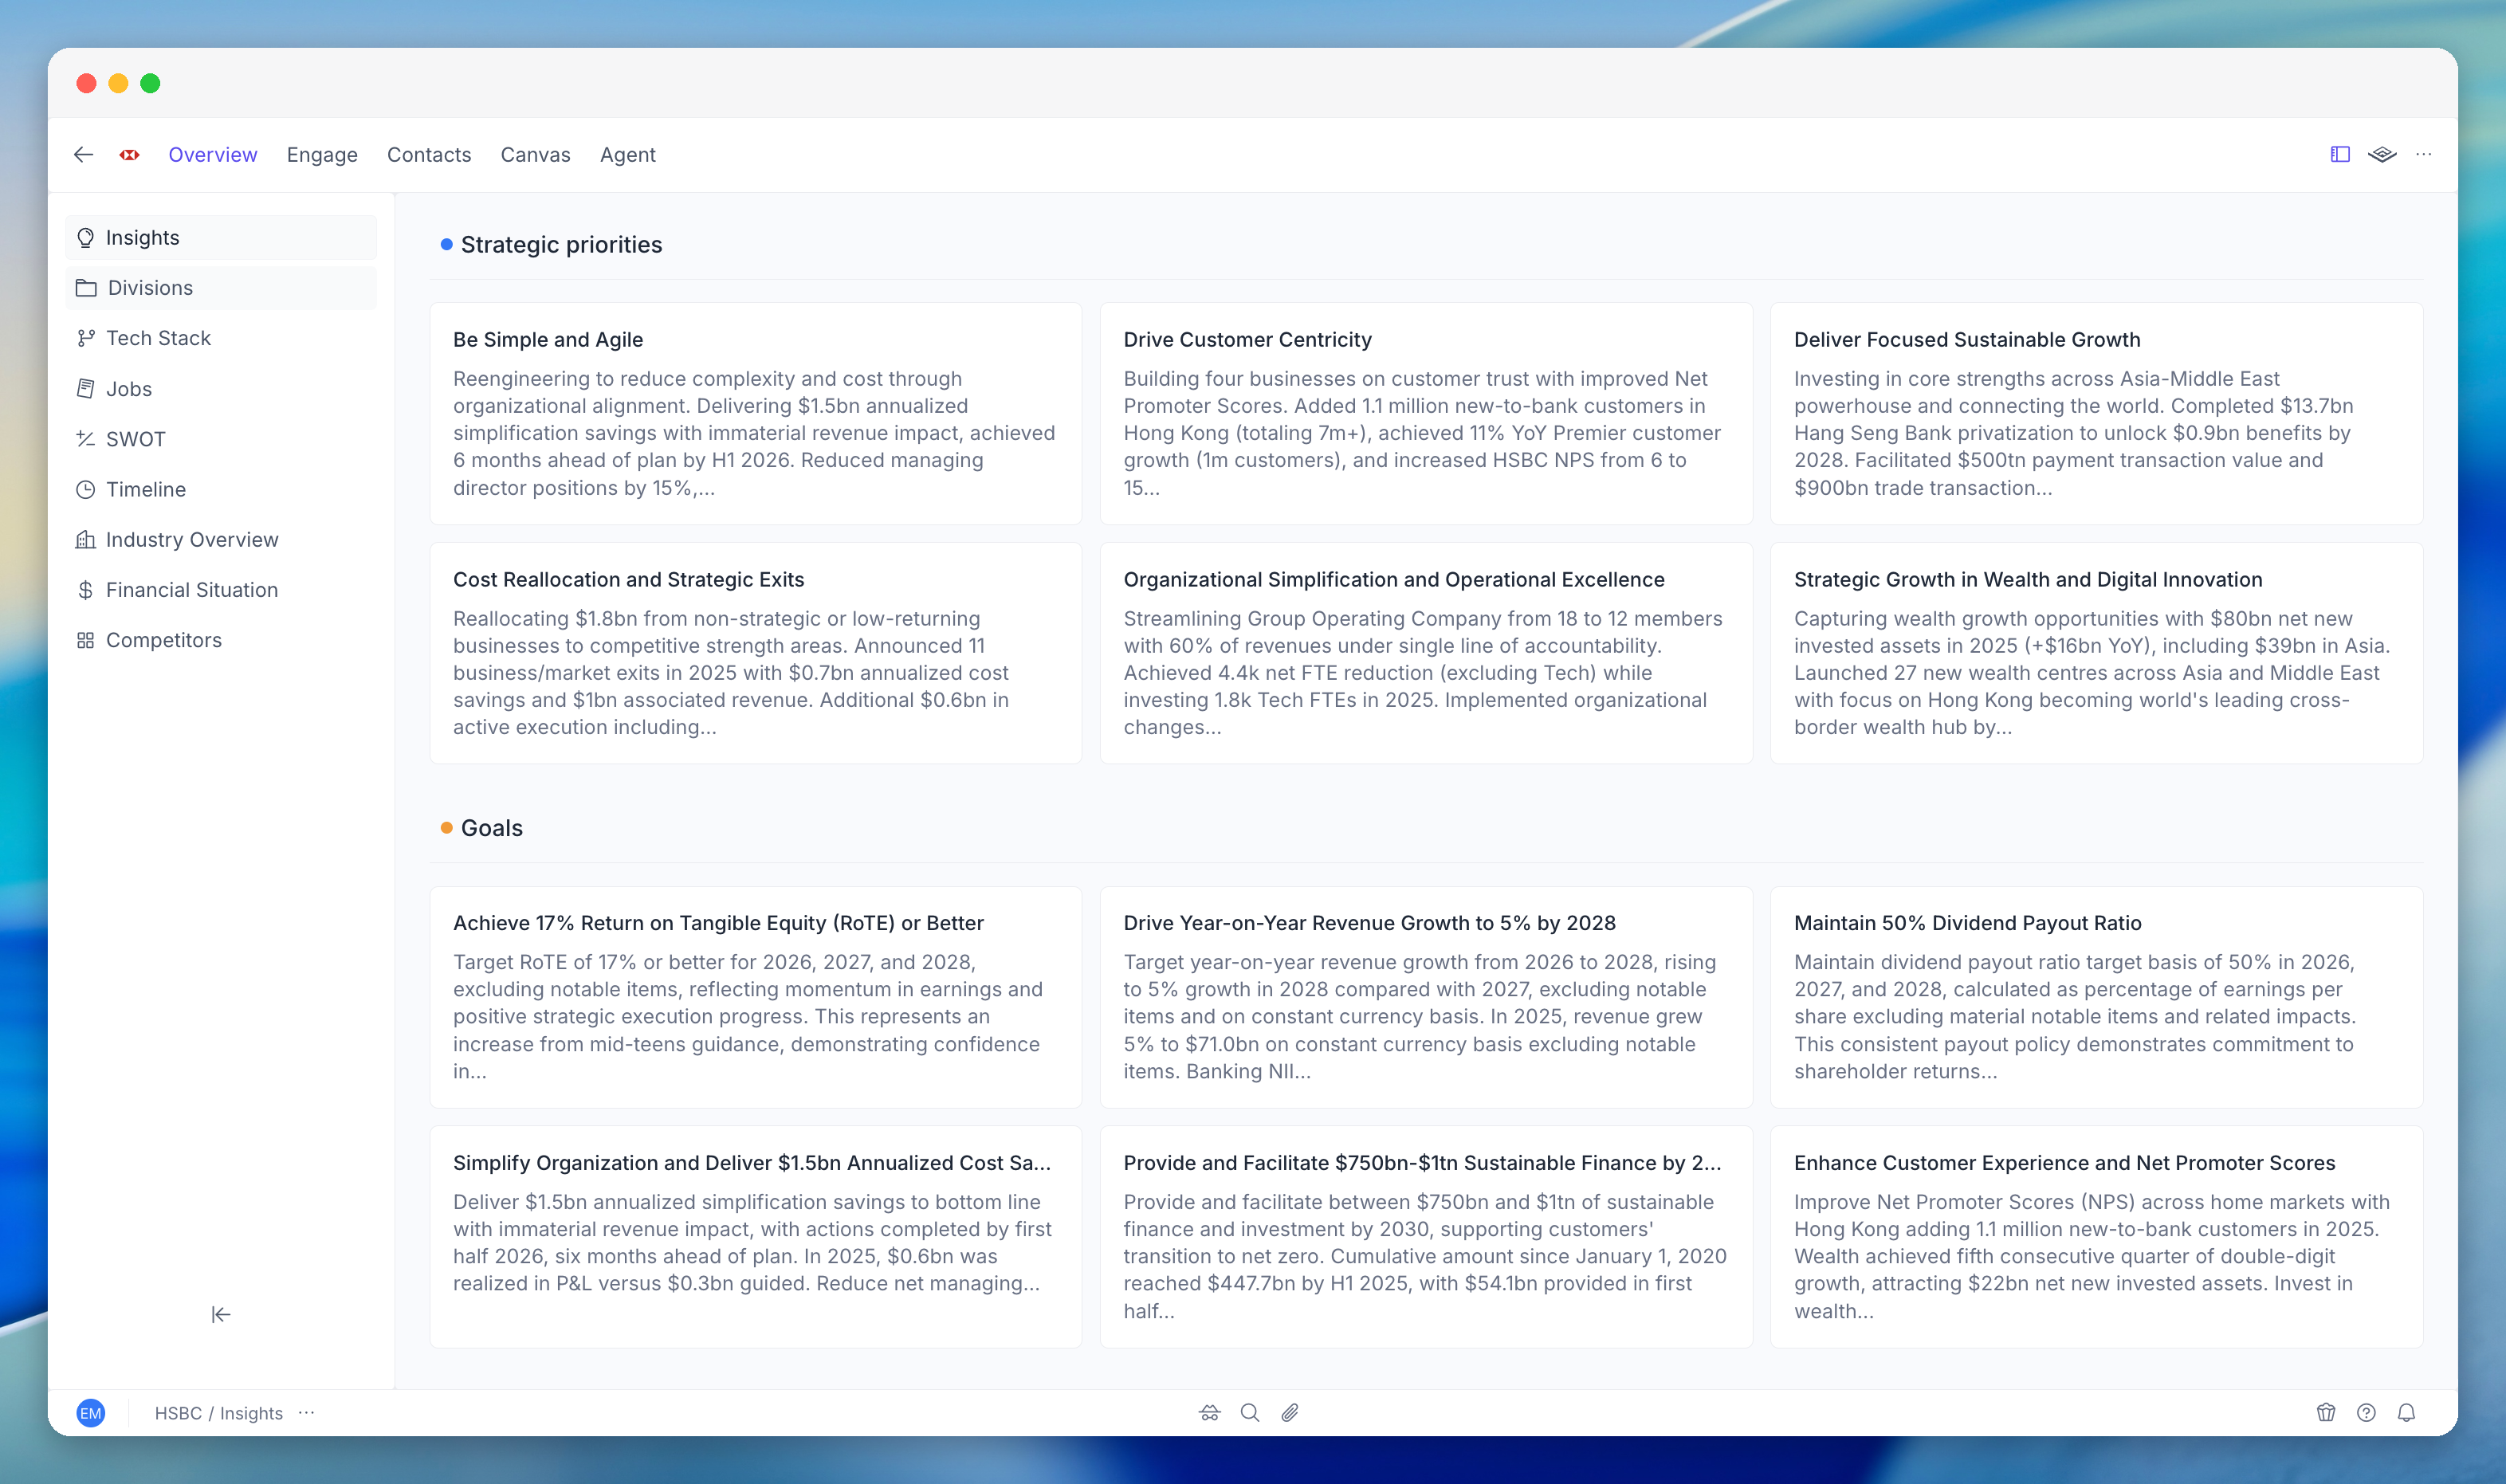
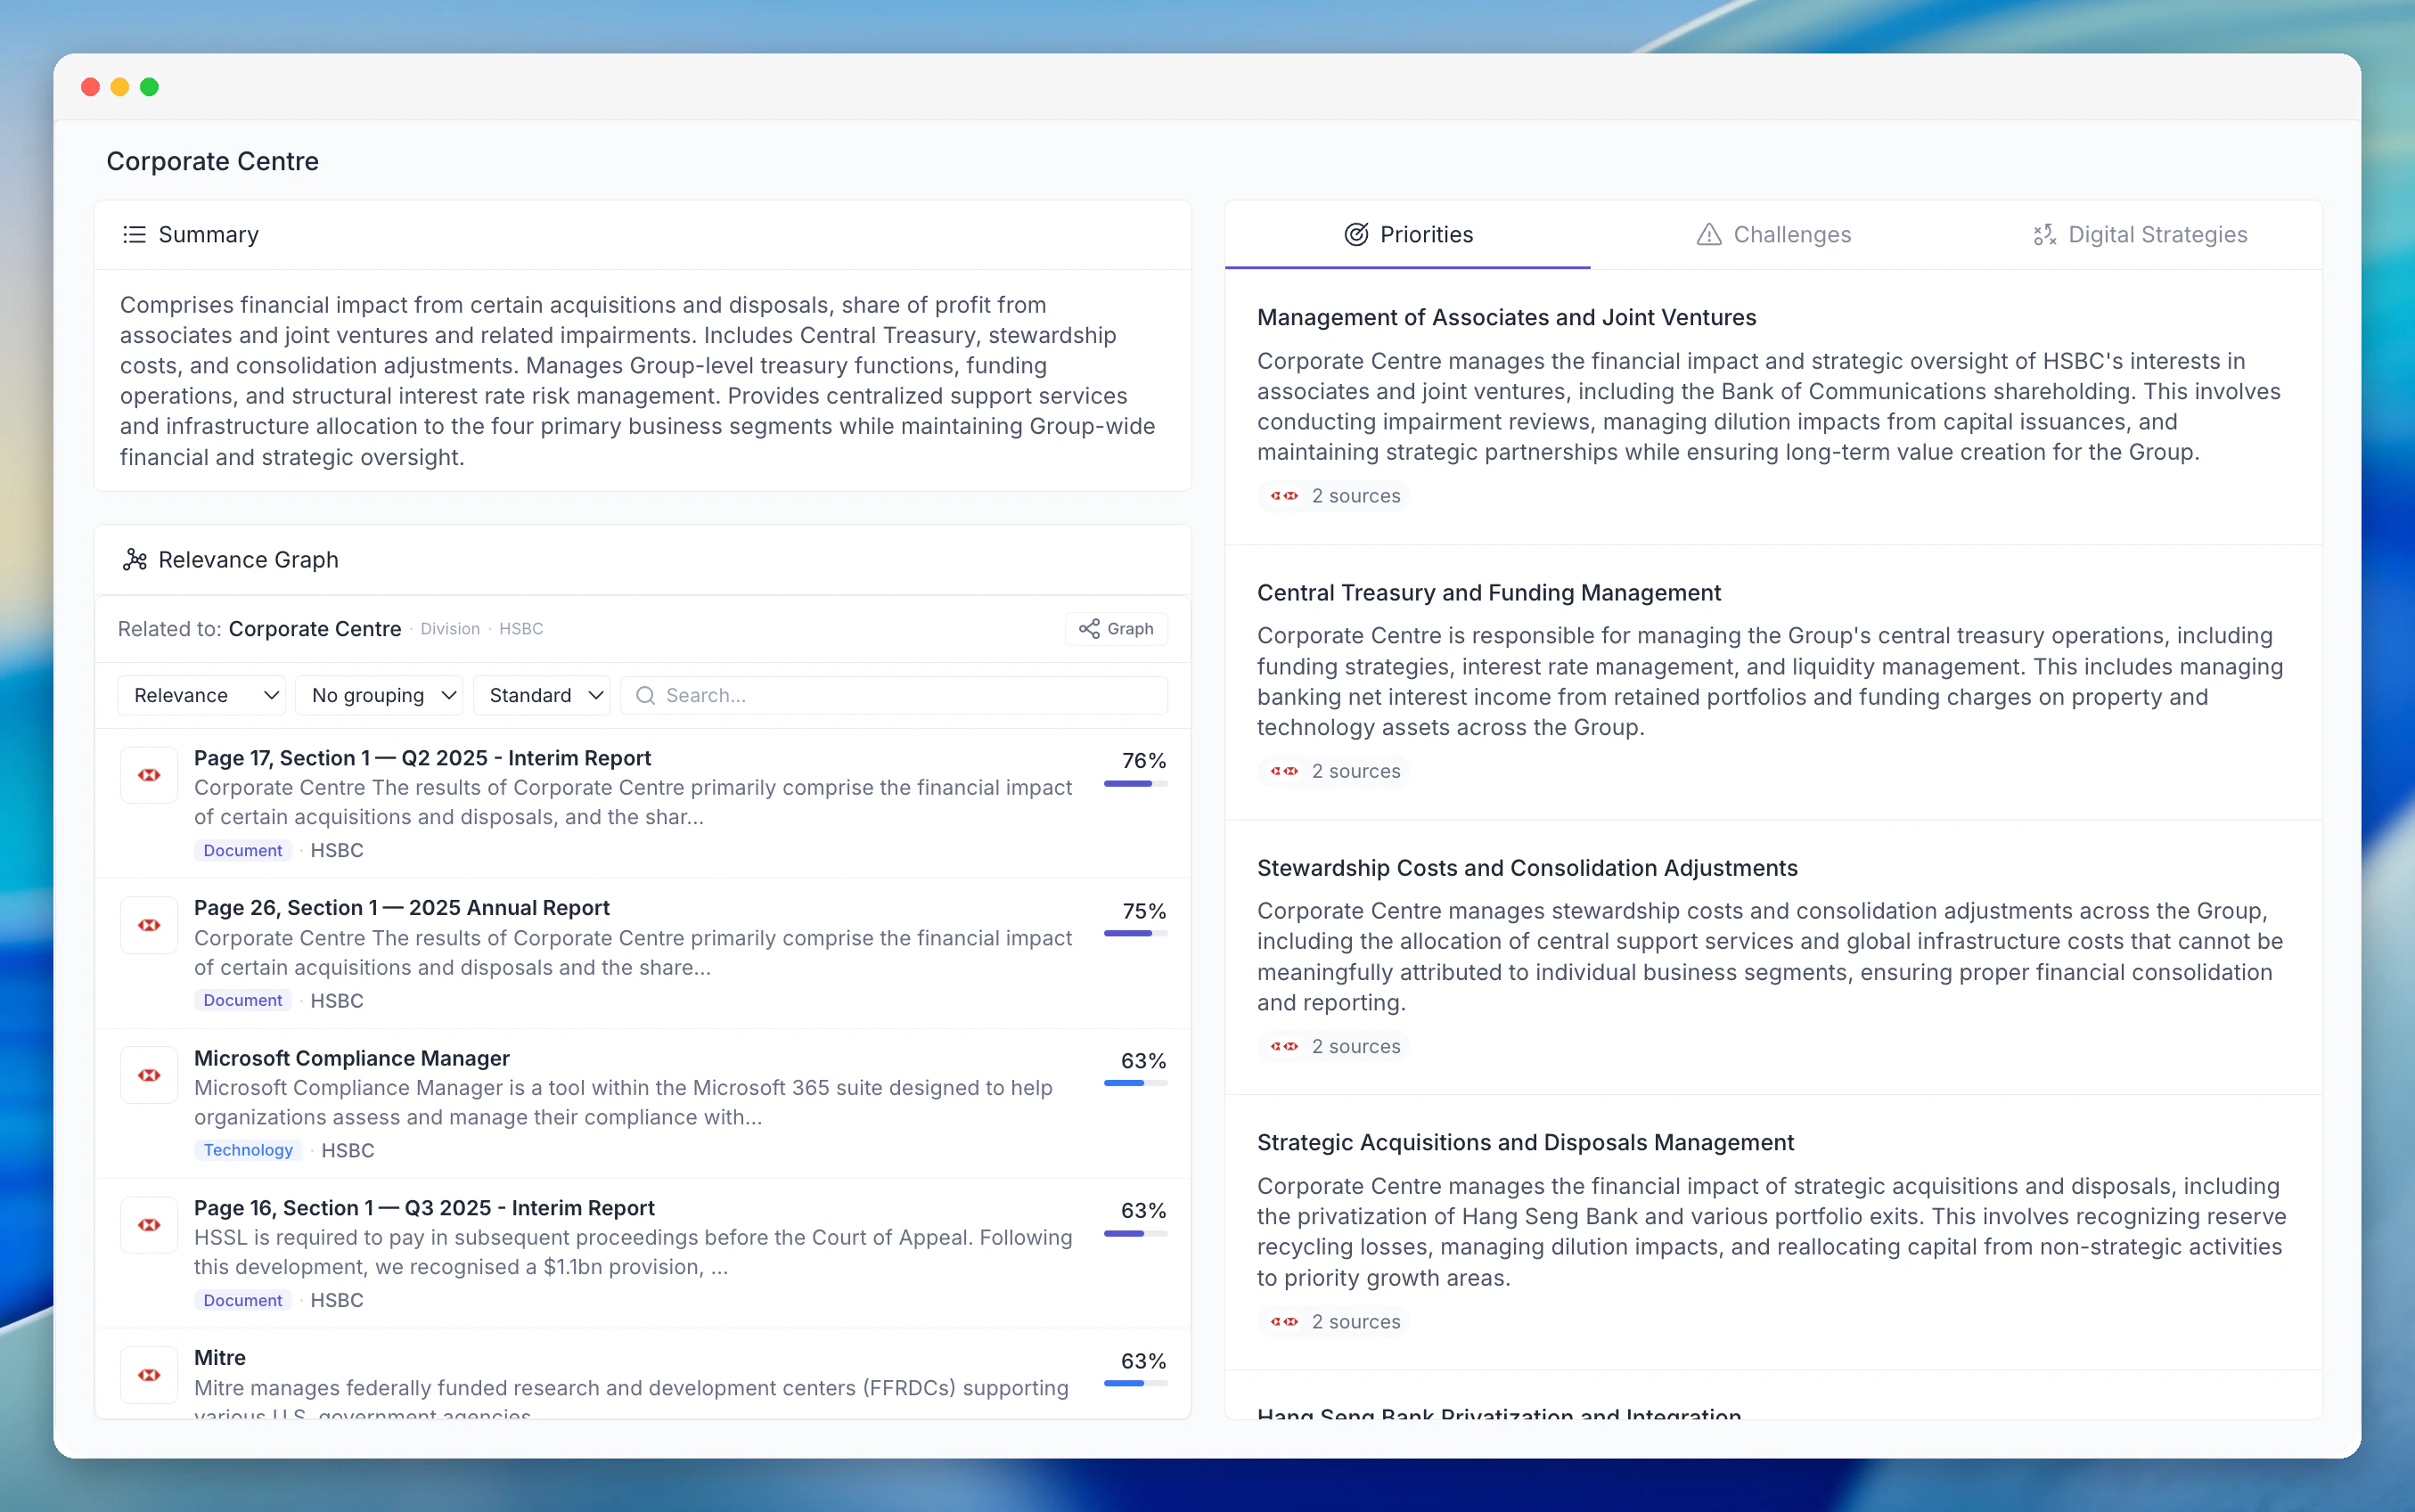
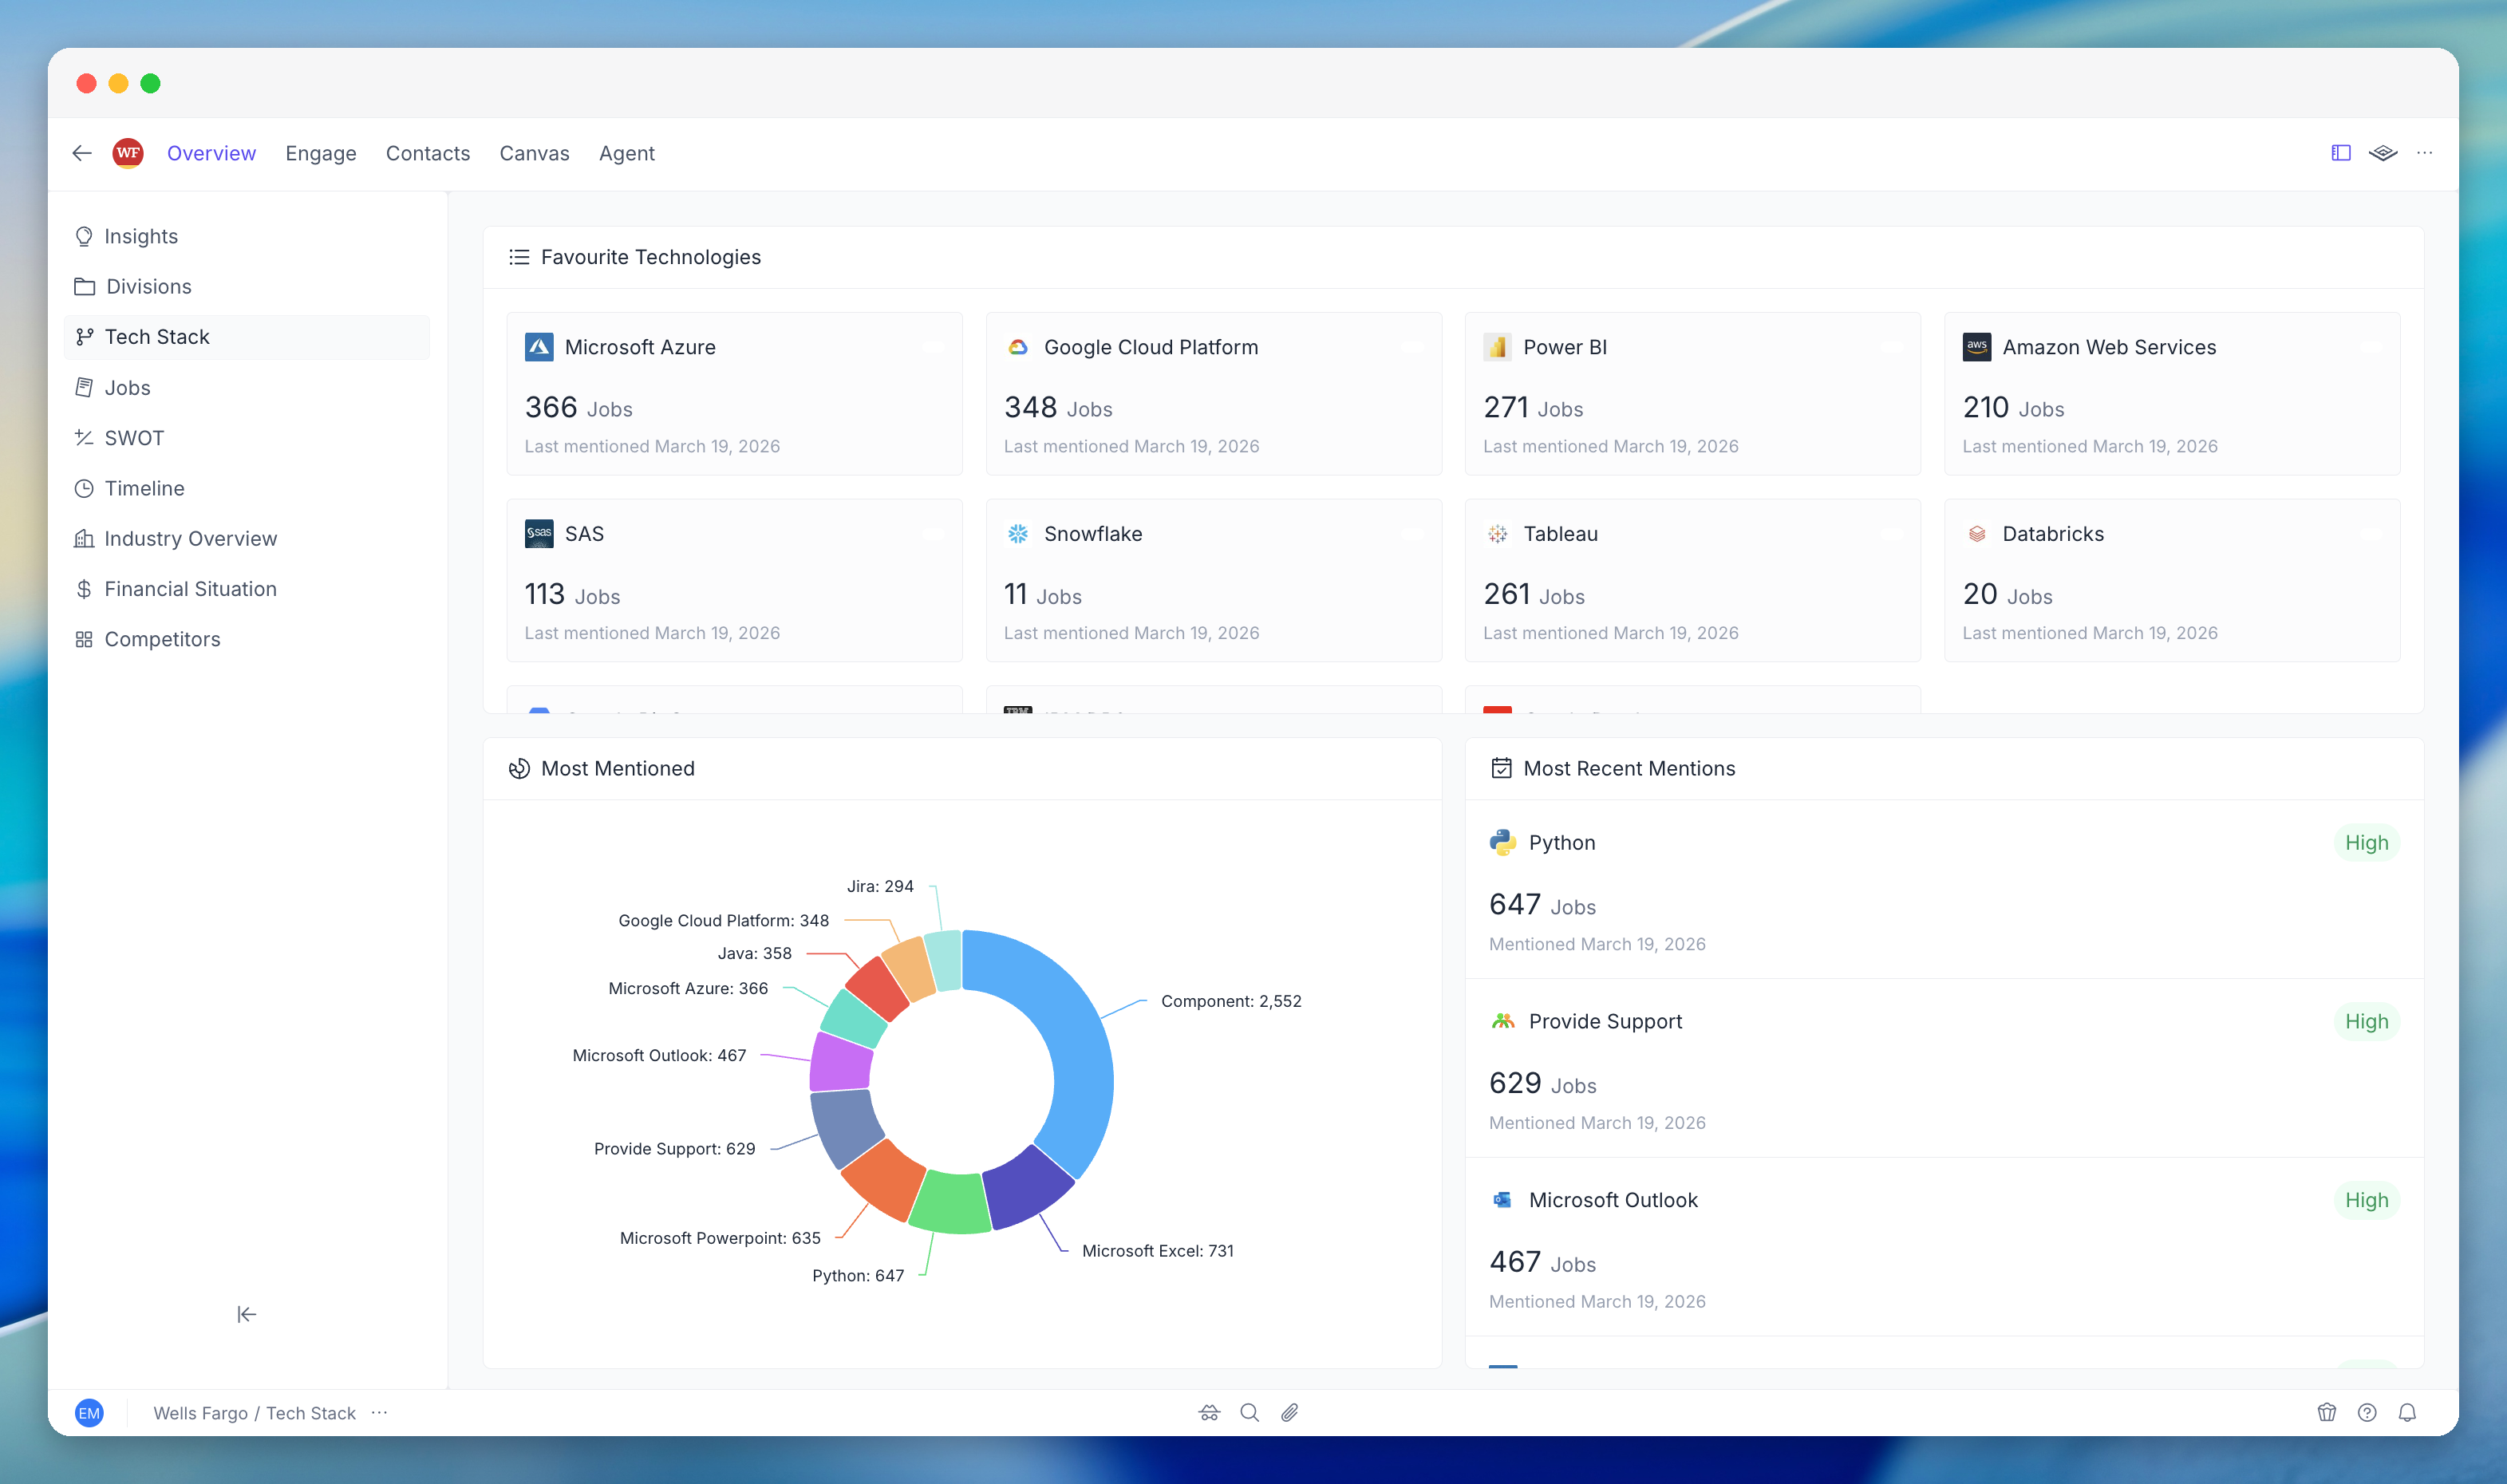
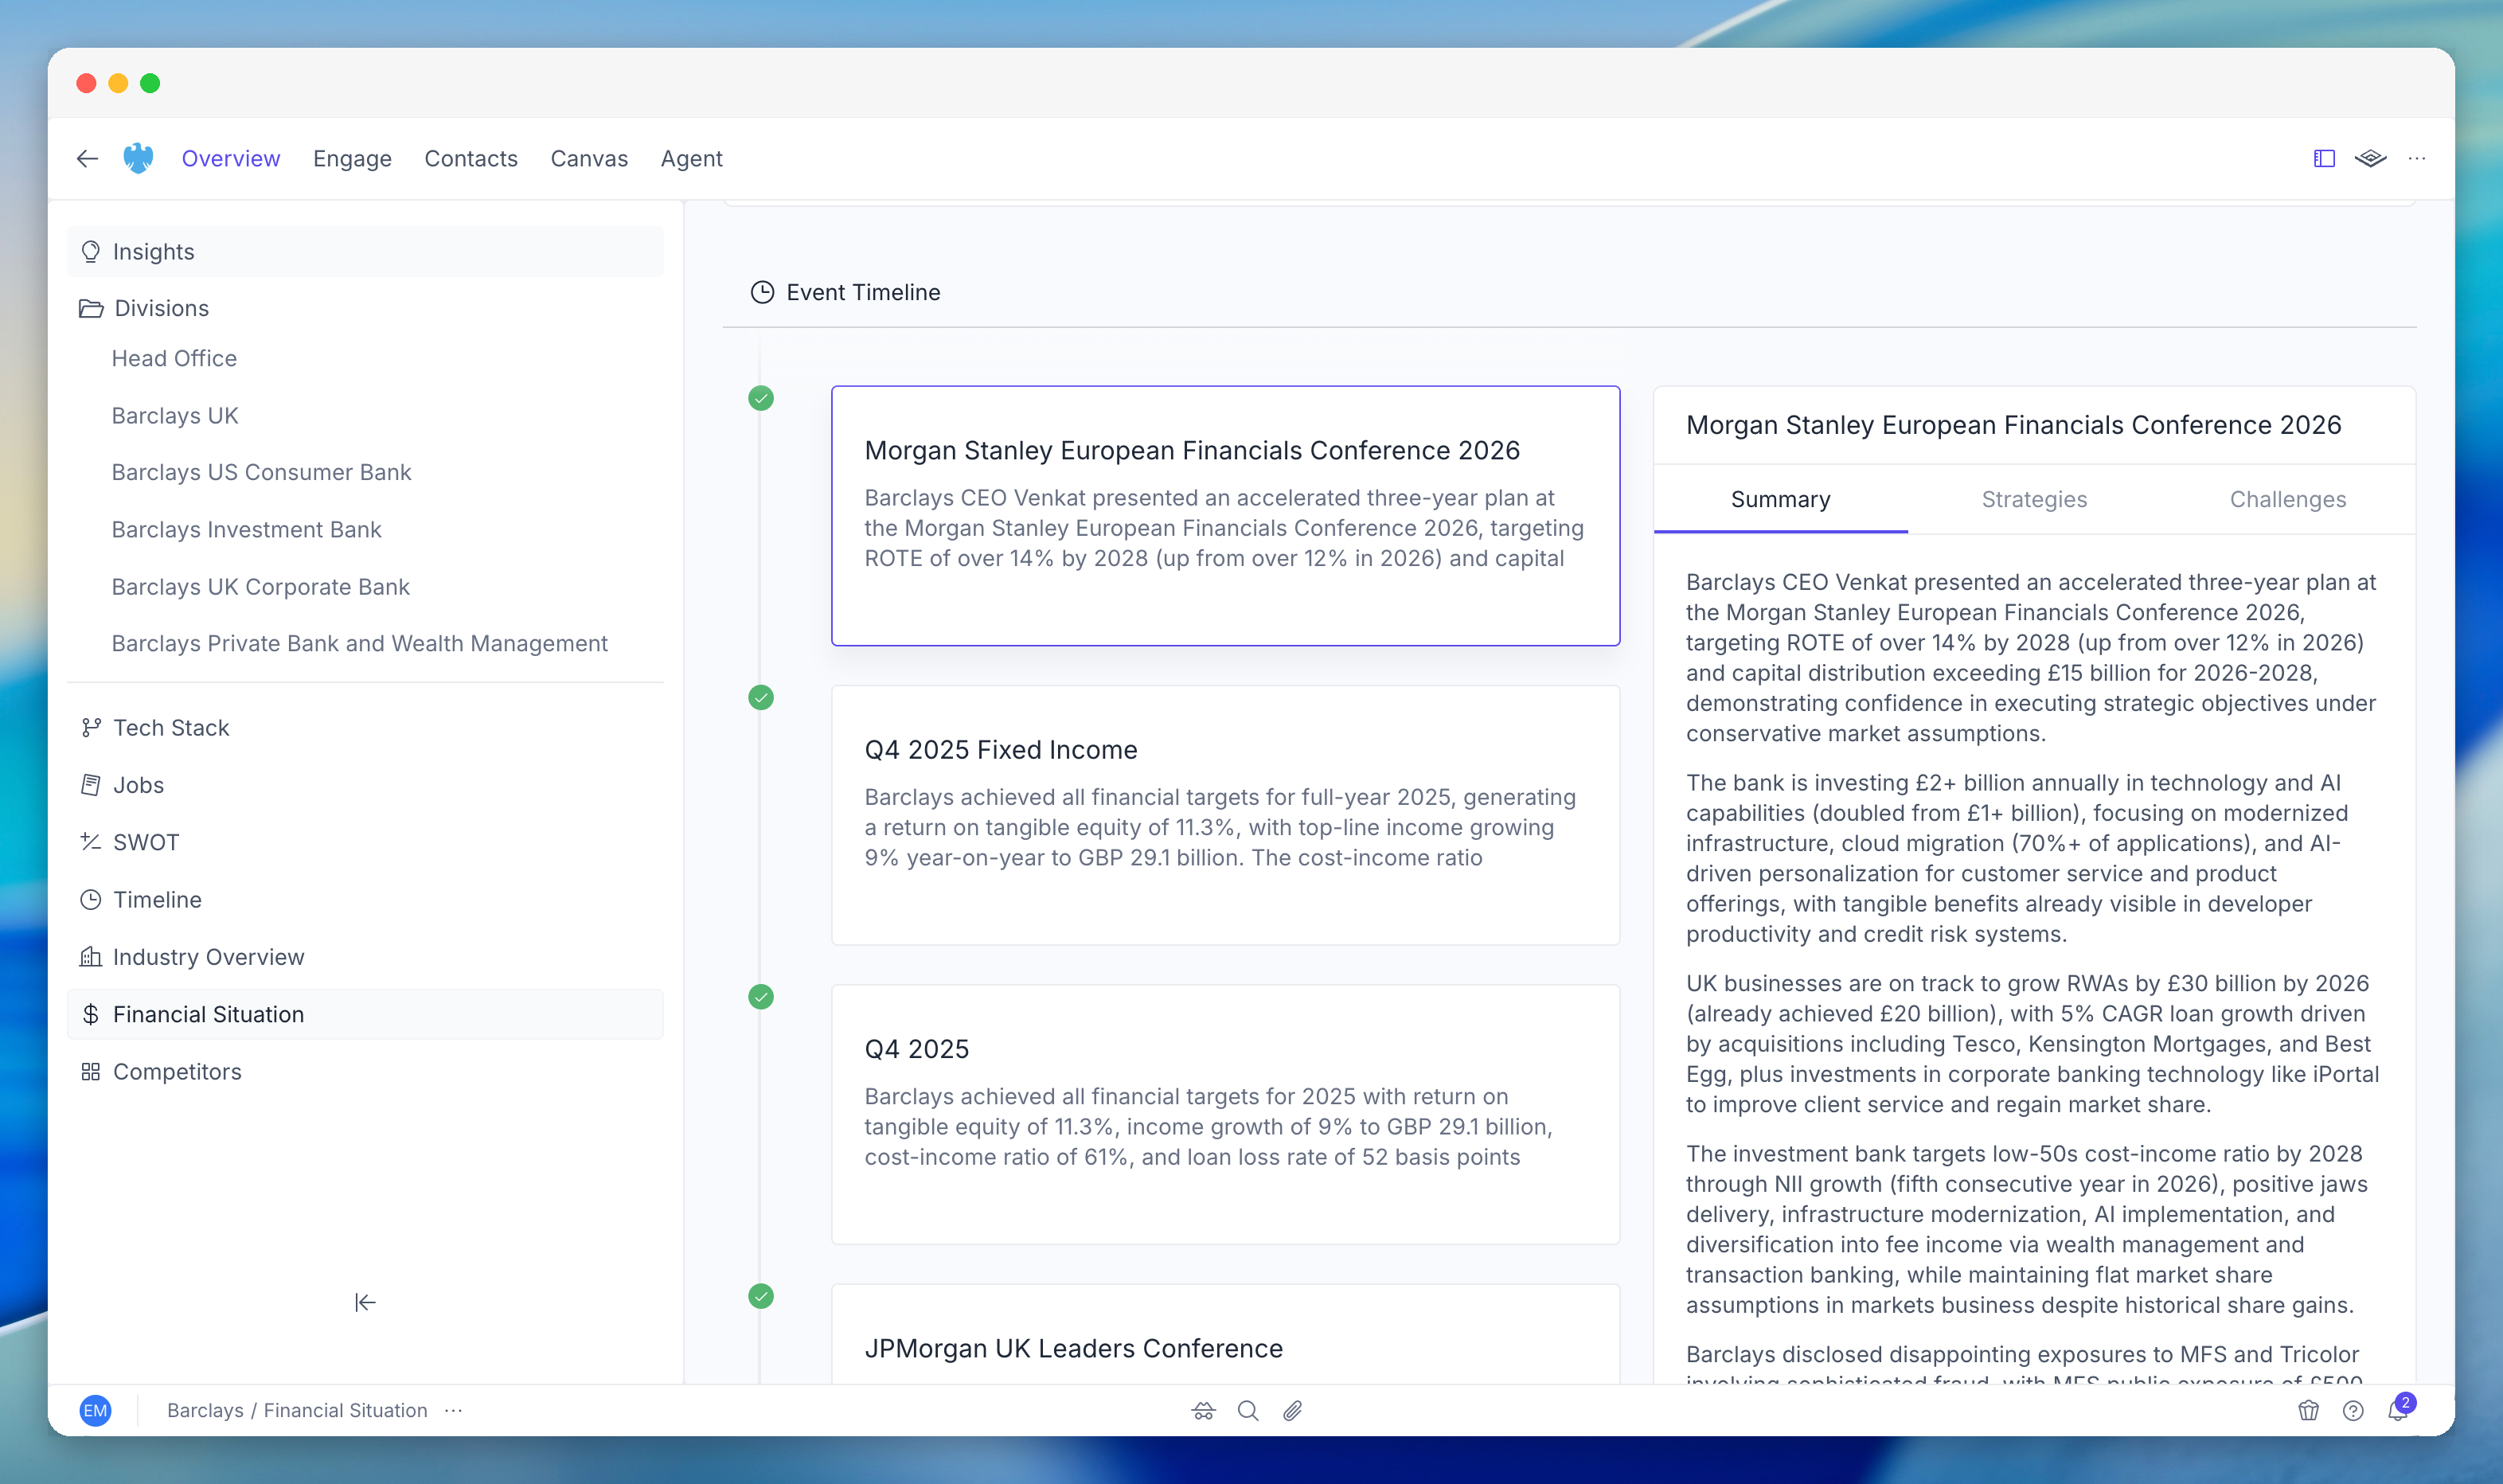
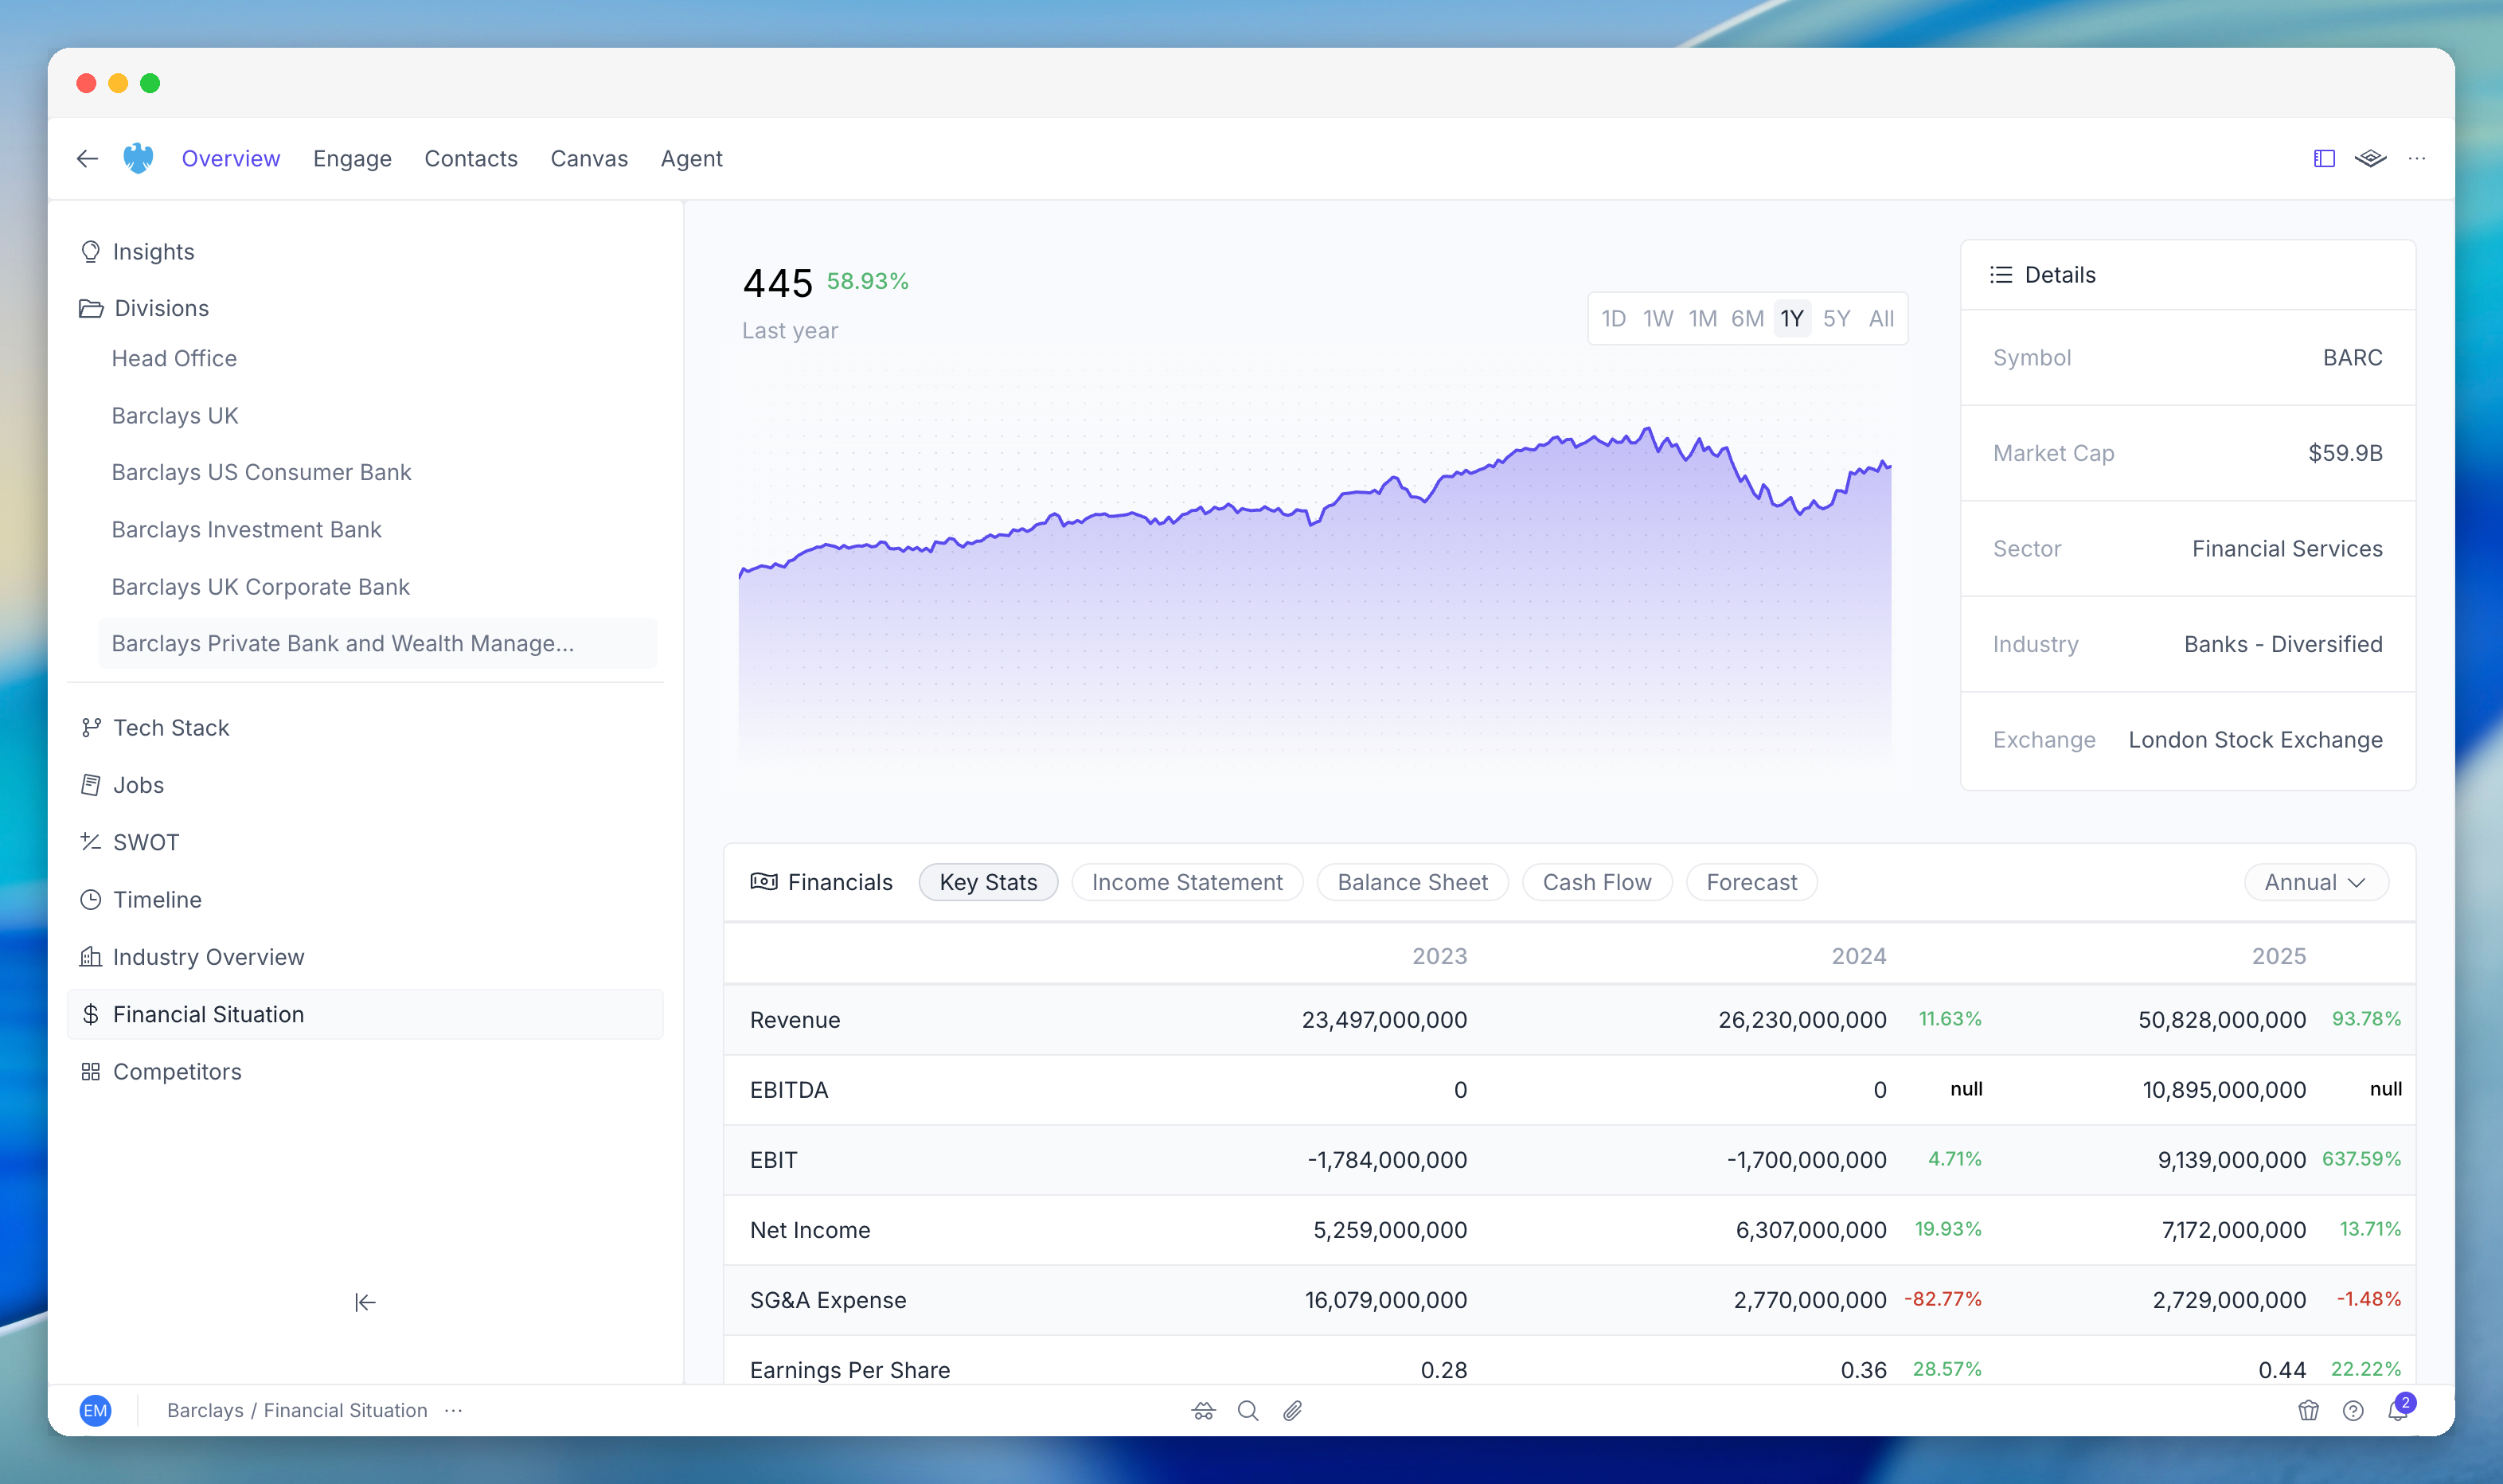
Platform & integrations
Public API
Programmatic access to PG:AI: companies, contacts, intelligence, the agent, and more. Build integrations, automate workflows, and pull PG:AI data into your existing tools.
MCP Server
Connect PG:AI to AI tools that support MCP (Model Context Protocol). Use PG:AI intelligence directly from Claude, Cursor, and other MCP-compatible clients.
Organisation analytics
Enhanced analytics for admins and team leaders. Track adoption, usage patterns, and team activity across the platform.
Getting started
If you’re an existing user, everything has been migrated. Your accounts, contacts, and intelligence data are all in V2, ready to go. Log in and explore. If you’re new to PG:AI:Quick start
Add your first accounts and see intelligence in minutes.
For AEs & SCs
How account executives and solutions consultants use PG:AI day to day.
For BDRs
How business development reps use PG:AI for prospecting and outreach.
Agent guide
What the agent can do and how to get the most out of it.