> ## Documentation Index
> Fetch the complete documentation index at: https://docs.getpg.ai/llms.txt
> Use this file to discover all available pages before exploring further.
# Scoring Models
> Build rule-based models that combine insight scores, enrichment data, job signals, and custom criteria into a single account rank.
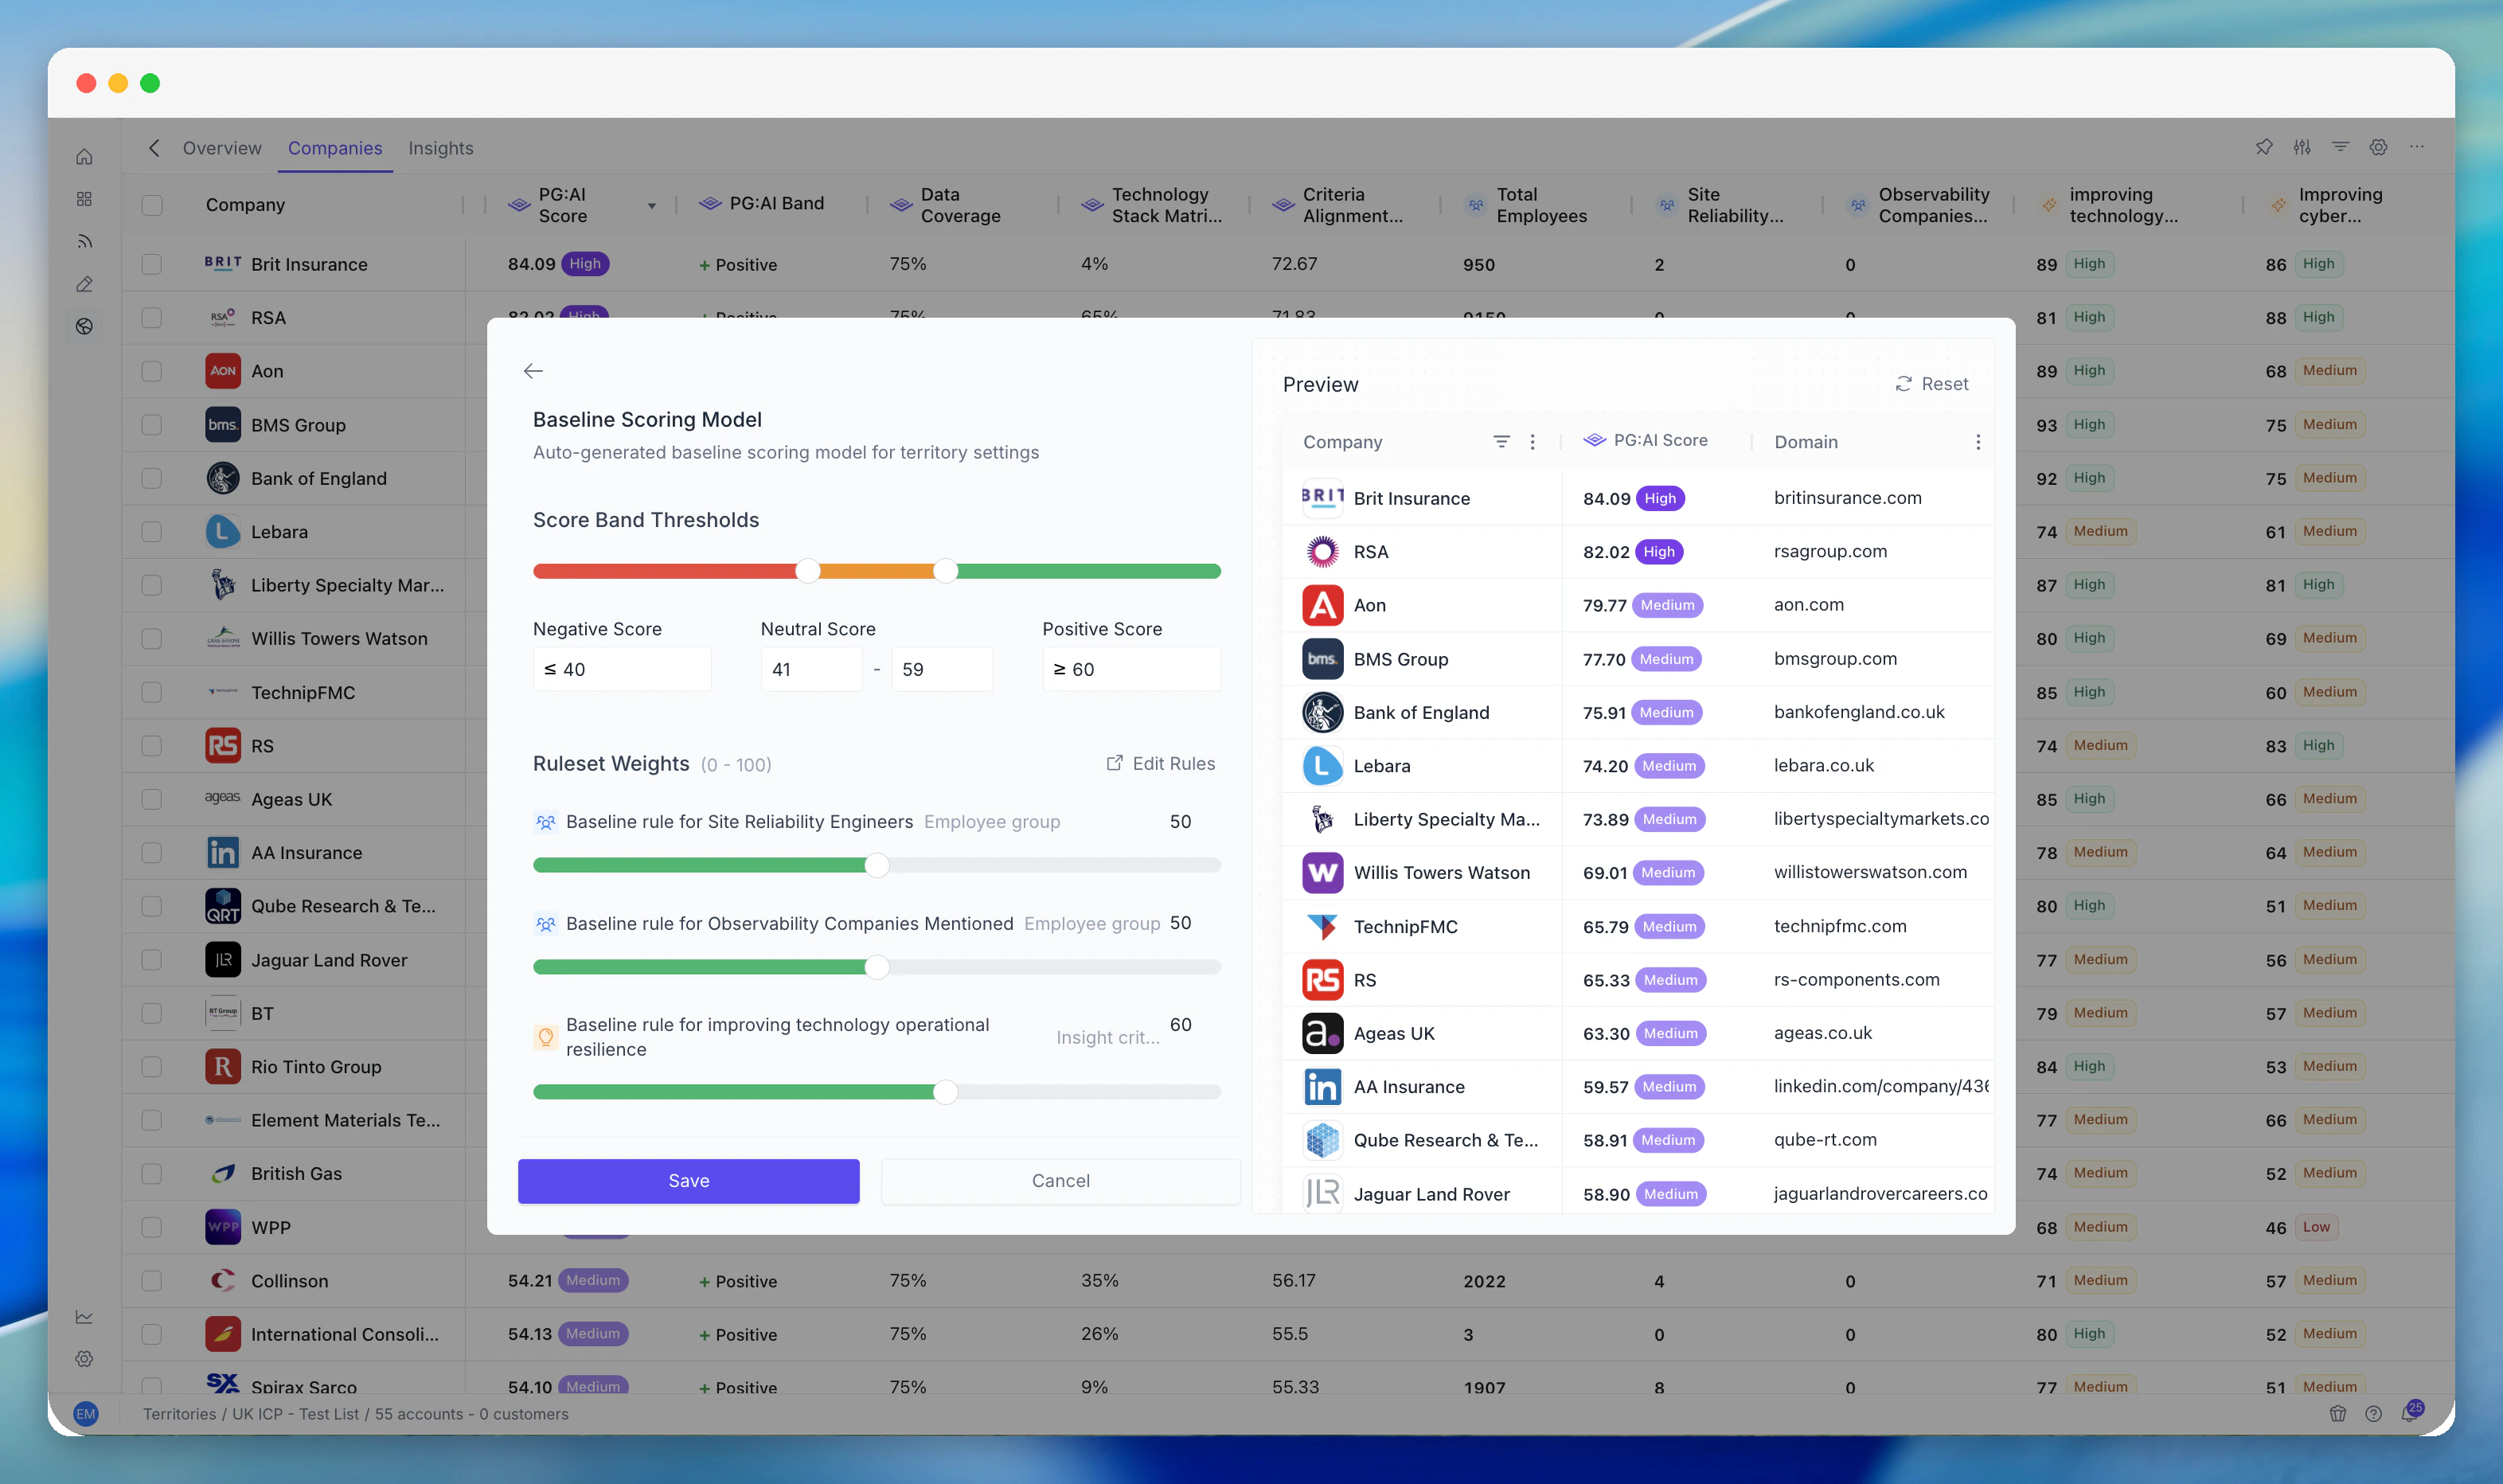
Scoring Models let you build rule-based models that combine insight scores, enrichment data, job signals, employee groups, financials, tech stack, and custom columns into a single composite score per account. Each rule maps a signal to a score contribution - and the model combines them into the **PG:AI Score** you see in the territory Companies table. Think of it as a recipe: each ingredient (signal) contributes a weighted amount to the final score.
 ## Key Capabilities
Build and manage multiple scoring models per territory. Define scoring rules, weight them, and publish models to make them live. Quick-start with baseline models or build from scratch.
Create rules for any data point - criteria scores, employee groups, jobs, enrichment, financials, tech stack, custom columns. Set thresholds and weights for each rule.
Score all accounts in a territory automatically. Scores recalculate as underlying data changes. See per-account score breakdowns showing how each rule contributed.
## How Scores Are Calculated
Each scoring model is built from **criteria** - the individual data points being evaluated. Each criterion has:
* **A data source** - which signal it looks at (insight score, employee group count, job posting count, etc.)
* **A weight** - how much this criterion matters relative to others
* **Thresholds** - the boundaries that determine scoring (e.g., "5+ DevOps Engineers = high signal")
The model runs these criteria against every account in the territory and produces a normalised score (typically 0–100).
### Example Rules
* "If insight score for 'cloud transformation' > 70, add 20 points"
* "If employee group 'data engineering' has 5+ people, add 15 points"
* "If company revenue > \$100M, add 10 points"
* "If hiring for relevant roles (from Jobs), add 10 points"
## Reading Account Scores
### In the Companies Table
| Column | What it shows |
| --------------- | ------------------------------------------------------------- |
| **PG:AI Score** | The overall numerical score from the active scoring model |
| **Score badge** | High / Medium / Low - colour-coded classification |
| **Sentiment** | Positive / Neutral - directional indicator of recent change |
### Score Badge Thresholds
The score badge is determined by the thresholds configured in the scoring model:
* **High** (green) - above the upper threshold
* **Medium** (amber) - between the thresholds
* **Low** (red/grey) - below the lower threshold
The exact boundaries depend on how the model is configured. Check with your admin if you're unsure where the cutoffs are.
## Common Workflows
### Understanding Why an Account Scored High
Navigate to the account in the territory.
Look at insight scores, employee groups, jobs, firmographic data.
The account is scoring high because it performs well on the criteria that carry the most weight. For example: if the model heavily weights "DevOps Engineers" and "Cloud Transformation" insight score, an account with 50 DevOps Engineers and a 90 on Cloud Transformation will score very high - even if it's a small company.
### Questioning a Score That Seems Wrong
If an account looks like a great fit but scores low (or vice versa):
Is it looking at the right signals for your use case?
Has the account been fully enriched? Missing data leads to lower scores.
Maybe the model over-weights a criterion that doesn't apply to this account.
The model may need adjusting, or a different model may be more appropriate.
### Comparing Score Distributions
Navigate to the territory Overview for a summary of score distribution.
Look at how many accounts are High, Medium, and Low.
A healthy territory typically has a pyramid: fewer Highs, more Mediums, most Lows.
If everything is Medium, the model may need sharper differentiation (wider weight spread or stricter thresholds).
### Acting on Score Changes
Scores aren't static - they update as new data flows in (new job postings, updated enrichment, market changes).
Periodically check for accounts that moved up (Medium → High). These are emerging opportunities.
Look for accounts that dropped (High → Medium). Investigate why - did they stop hiring? Did an insight score decline?
The Sentiment column helps - Positive sentiment suggests upward movement.
## Multiple Scoring Models
Your territory may have access to more than one scoring model. Each model can be built for a different purpose:
* **ICP Model** - scores accounts against your ideal customer profile
* **Expansion Model** - scores existing customers for upsell potential
* **New Logo Model** - scores net-new accounts for acquisition fit
The active model determines the PG:AI Score shown in the Companies table. You can switch models to see the same accounts scored from different angles.
## Tips and Best Practices
**Trust the model, but verify** - scoring models surface patterns at scale. For your top accounts, always click in and understand what's driving the score.
**Don't chase the score, chase the story** - a high score gets the account onto your radar. The combination of insight scores, jobs, employee groups, and firmographic data tells you why they're a fit and how to engage.
* **Request model updates** - if the model isn't differentiating well (too many accounts at the same score), ask your admin to review the weights and criteria.
* **Use scores for prioritisation, not elimination** - a low score doesn't mean "don't engage." It means "other accounts are probably a better use of your time right now."
* **Combine model score with your own knowledge** - you know your accounts. The model knows the data. Together, you make better decisions.
## Related Modules
Insight scores are a primary input to scoring model rules.
Employee group headcounts and role data feed scoring rules.
Hiring signals are an input to scoring rules.
Custom data can be used in scoring rules.
Scoring model outputs drive AI-powered recommendations.
Scoring results surface in analytics.
## Key Capabilities
Build and manage multiple scoring models per territory. Define scoring rules, weight them, and publish models to make them live. Quick-start with baseline models or build from scratch.
Create rules for any data point - criteria scores, employee groups, jobs, enrichment, financials, tech stack, custom columns. Set thresholds and weights for each rule.
Score all accounts in a territory automatically. Scores recalculate as underlying data changes. See per-account score breakdowns showing how each rule contributed.
## How Scores Are Calculated
Each scoring model is built from **criteria** - the individual data points being evaluated. Each criterion has:
* **A data source** - which signal it looks at (insight score, employee group count, job posting count, etc.)
* **A weight** - how much this criterion matters relative to others
* **Thresholds** - the boundaries that determine scoring (e.g., "5+ DevOps Engineers = high signal")
The model runs these criteria against every account in the territory and produces a normalised score (typically 0–100).
### Example Rules
* "If insight score for 'cloud transformation' > 70, add 20 points"
* "If employee group 'data engineering' has 5+ people, add 15 points"
* "If company revenue > \$100M, add 10 points"
* "If hiring for relevant roles (from Jobs), add 10 points"
## Reading Account Scores
### In the Companies Table
| Column | What it shows |
| --------------- | ------------------------------------------------------------- |
| **PG:AI Score** | The overall numerical score from the active scoring model |
| **Score badge** | High / Medium / Low - colour-coded classification |
| **Sentiment** | Positive / Neutral - directional indicator of recent change |
### Score Badge Thresholds
The score badge is determined by the thresholds configured in the scoring model:
* **High** (green) - above the upper threshold
* **Medium** (amber) - between the thresholds
* **Low** (red/grey) - below the lower threshold
The exact boundaries depend on how the model is configured. Check with your admin if you're unsure where the cutoffs are.
## Common Workflows
### Understanding Why an Account Scored High
Navigate to the account in the territory.
Look at insight scores, employee groups, jobs, firmographic data.
The account is scoring high because it performs well on the criteria that carry the most weight. For example: if the model heavily weights "DevOps Engineers" and "Cloud Transformation" insight score, an account with 50 DevOps Engineers and a 90 on Cloud Transformation will score very high - even if it's a small company.
### Questioning a Score That Seems Wrong
If an account looks like a great fit but scores low (or vice versa):
Is it looking at the right signals for your use case?
Has the account been fully enriched? Missing data leads to lower scores.
Maybe the model over-weights a criterion that doesn't apply to this account.
The model may need adjusting, or a different model may be more appropriate.
### Comparing Score Distributions
Navigate to the territory Overview for a summary of score distribution.
Look at how many accounts are High, Medium, and Low.
A healthy territory typically has a pyramid: fewer Highs, more Mediums, most Lows.
If everything is Medium, the model may need sharper differentiation (wider weight spread or stricter thresholds).
### Acting on Score Changes
Scores aren't static - they update as new data flows in (new job postings, updated enrichment, market changes).
Periodically check for accounts that moved up (Medium → High). These are emerging opportunities.
Look for accounts that dropped (High → Medium). Investigate why - did they stop hiring? Did an insight score decline?
The Sentiment column helps - Positive sentiment suggests upward movement.
## Multiple Scoring Models
Your territory may have access to more than one scoring model. Each model can be built for a different purpose:
* **ICP Model** - scores accounts against your ideal customer profile
* **Expansion Model** - scores existing customers for upsell potential
* **New Logo Model** - scores net-new accounts for acquisition fit
The active model determines the PG:AI Score shown in the Companies table. You can switch models to see the same accounts scored from different angles.
## Tips and Best Practices
**Trust the model, but verify** - scoring models surface patterns at scale. For your top accounts, always click in and understand what's driving the score.
**Don't chase the score, chase the story** - a high score gets the account onto your radar. The combination of insight scores, jobs, employee groups, and firmographic data tells you why they're a fit and how to engage.
* **Request model updates** - if the model isn't differentiating well (too many accounts at the same score), ask your admin to review the weights and criteria.
* **Use scores for prioritisation, not elimination** - a low score doesn't mean "don't engage." It means "other accounts are probably a better use of your time right now."
* **Combine model score with your own knowledge** - you know your accounts. The model knows the data. Together, you make better decisions.
## Related Modules
Insight scores are a primary input to scoring model rules.
Employee group headcounts and role data feed scoring rules.
Hiring signals are an input to scoring rules.
Custom data can be used in scoring rules.
Scoring model outputs drive AI-powered recommendations.
Scoring results surface in analytics.